Geoscience Reference
In-Depth Information
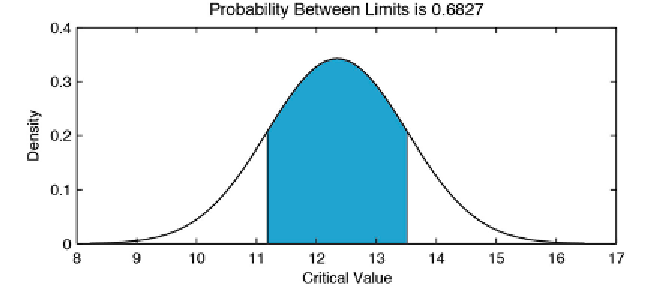
Fig. 3.12
Plot of a standard normal distribution between specii ed limits. As an example, the
shaded area displays the ʼ±˃ range of a Gaussian distribution with a mean ʼ=12.3448 and a
standard deviation ˃=1.1660.
3.6 Hypothesis Testing
h e remaining sections in this chapter are concerned with methods used to
draw conclusions from the statistical sample that can then be applied to the
larger population of interest (
hypothesis testing
). All hypothesis tests share the
same concept and terminology. h e
null hypothesis
is an assertion about the
population describing the absence of a statistically signii cant characteristic
or ef ect, whereas an
alternative hypothesis
is a contrasting assertion. h e
p
-value of a hypothesis test is the probability, under the null hypothesis, of
observing larger values for the test statistic than those calculated from the
sample. h e
signii cance level
ʱ is the threshold of probability that controls
the outcome of the tests. If the
p
-value is smaller than ʱ, the null hypothesis
can be rejected; the outcome of the test is regarded as
signii cant
if
p
<0.05, or
highly signii cant
if
p
<0.01.
A hypothesis test can be performed either as a
one-tailed
(one-sided) or
two-tailed
(two-sided) test. h e term
tail
derives from the tailing of the data
to the far let or far right of a probability density function as, for instance, in
the standard normal distribution used in the Mann-Whitney and Ansari-
Bradley tests (Sections 3.11 and 3.12). As an example, the Mann-Whitney
test compares the medians of two data sets. h e one-tailed Mann-Whitney
test is used to test against the alternative hypothesis that the median of
the i rst sample is either smaller or larger than the median of the second
sample at a signii cance level of 5% (or 0.05). h e two-tailed Mann-Whitney
test is used when the medians are not equal at a 5% signii cance level, i.e.,
when it makes no dif erence which of the medians is larger. In this case, the