Geoscience Reference
In-Depth Information
signii cance level is halved, i.e., 2.5% is used instead of 5%.
We can display the standard normal distribution for the one-tailed test by
typing
clear
pd = makedist('normal',0,1)
y = icdf(pd,[0,.95]);
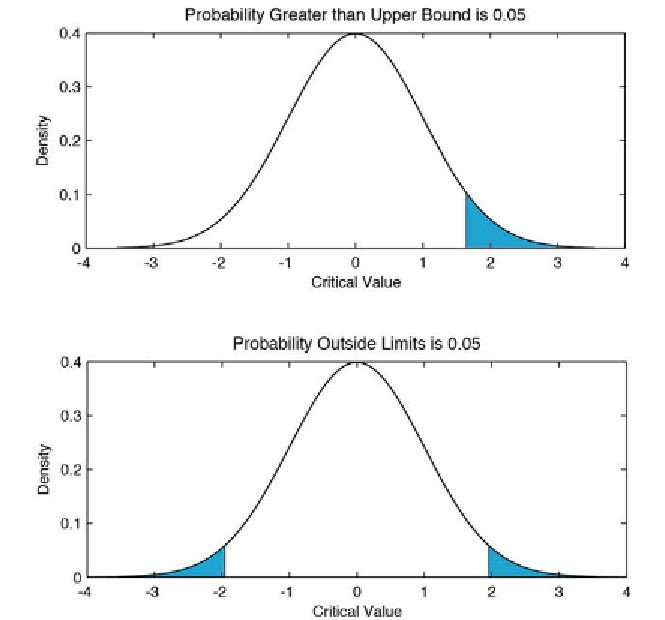
[p,h] = normspec(y,0,1,'outside');
and obtain a plot with one blue tail to the right, with the 5% area shaded (Fig.
3.13 a). Similarly, we can display the standard normal distribution for the
two-tailed test by typing
clear
a
b
Fig. 3.13
Plot of a standard normal distribution with
a
one, or
b
two, critical regions shown as
shaded areas that contain a total of 5% of the area under the curve.