Geoscience Reference
In-Depth Information
xlabel('Mineral 1')
ylabel('Mineral 3')
subplot(1,3,3),
plot(x(:,2),x(:,3),'o')
xlabel('Mineral 2')
ylabel('Mineral 3')
h e
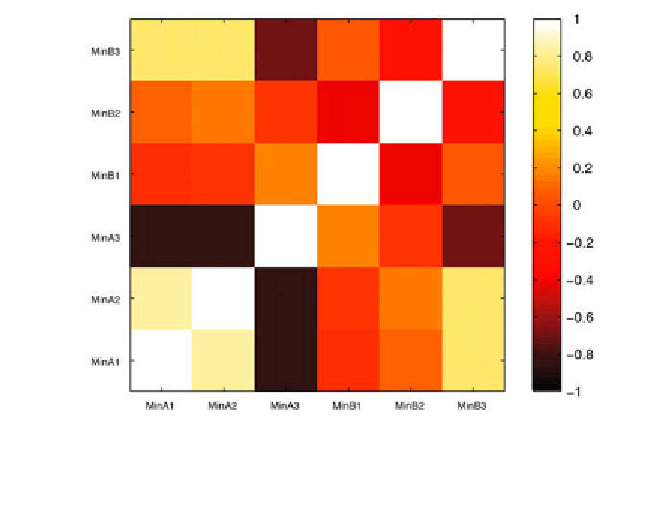
correlation matrix
provides a technique for exploring such dependencies
between the variables in the data set (i.e., the three minerals in our example).
h e elements of the correlation matrix are Pearson's correlation coei cients
(Chapter 4) for each pair of variables, as shown in Figure 9.2.
corrmatrix = corrcoef(x);
corrmatrix = flipud(corrmatrix);
imagesc(corrmatrix), colormap(hot), caxis([-1 1])
title('Correlation Matrix')
axis square, colorbar, hold
set(gca,'XTick',[1 2 3],...
'XTickLabel',minerals,...
'YTick',[1 2 3],...
'YTickLabel',flipud(minerals))
h is pseudocolor plot of the correlation coei cients coni rms the correlations
Fig. 9.2
Correlation matrix containing Pearson's correlation coei cients for each pair of
variables (for example, minerals in a sediment sample). Light colors represent strong positive
linear correlations, while dark colors represent negative correlations. Orange suggests no
correlation.