Geoscience Reference
In-Depth Information
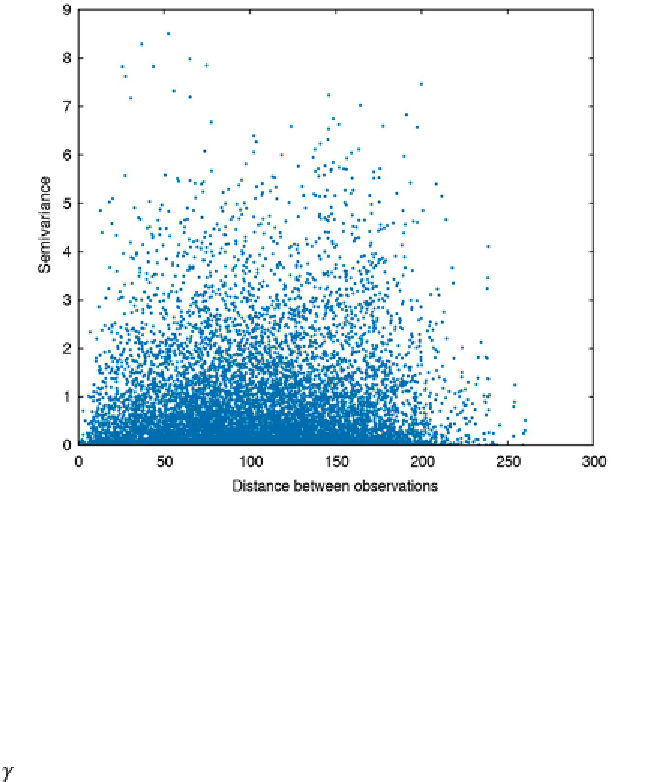
Fig. 7.18
Variogram cloud: plot of the experimental variogram (half the squared dif erence
between pairs of observations) versus the lag distance (separation distance between the two
components of a pair).
estimator is the averaged empirical variogram within certain distance
classes or bins dei ned by multiples of the lag interval. h e classii cation of
separation distances is illustrated in Figure 7.19. h e variogram estimator is
calculated by:
where
N
(
h
) is the number of pairs within the lag interval
h
.
We i rst need to decide on a suitable lag interval
h
. If sampling has been
carried out on a regular grid, the length of a grid cell can be used. If the
samples are unevenly spaced, as in our case, the mean minimum distance
of pairs is a good starting point for the lag interval (Webster and Oliver
2001). To calculate the mean minimum distance of pairs we need to replace
the zeros in the diagonal of the lag matrix
D
with
NaN
s, otherwise the mean
minimum distance will be zero: