Geoscience Reference
In-Depth Information
h is i lter clearly changes the signal dramatically. h e output contains only
low-frequency components and all higher frequencies have been eliminated.
A comparison of the periodograms for the input and the output reveals that
all frequencies above
f
=0.1 (corresponding to a period of ˄=10) have been
suppressed.
[Pxx,f] = periodogram(x5,[],128,1);
[Pyy,f] = periodogram(y5,[],128,1);
plot(f,Pxx,f,Pyy)
We have now designed a frequency-selective i lter, i.e., a i lter that eliminates
certain frequencies while leaving other frequencies relatively unaf ected. h e
next section introduces tools that are used to characterize a i lter in the time
and frequency domains and to predict the ef ect of a frequency-selective
i lter on arbitrary signals.
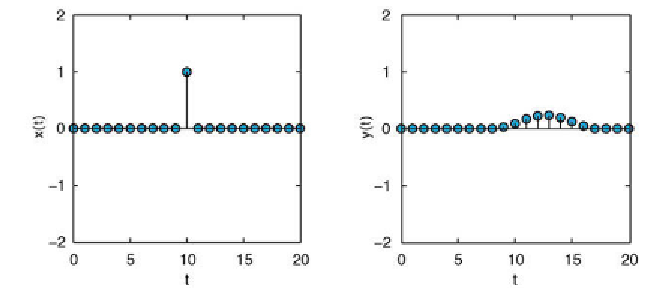
6.7 Impulse Response
h e impulse response is a very convenient way of describing the characteristics
of a i lter (Fig. 6.3). h e impulse response
h
is useful in LTI systems where
the convolution of the input signal
x
(
t
) with
h
is used to obtain the output
signal
y
(
t
).
b
a
Fig. 6.3
Transformation of
a
a unit impulse to compute
b
the impulse response of a system.
h e impulse response is ot en used to describe and predict the performance of a i lter.