Graphics Reference
In-Depth Information
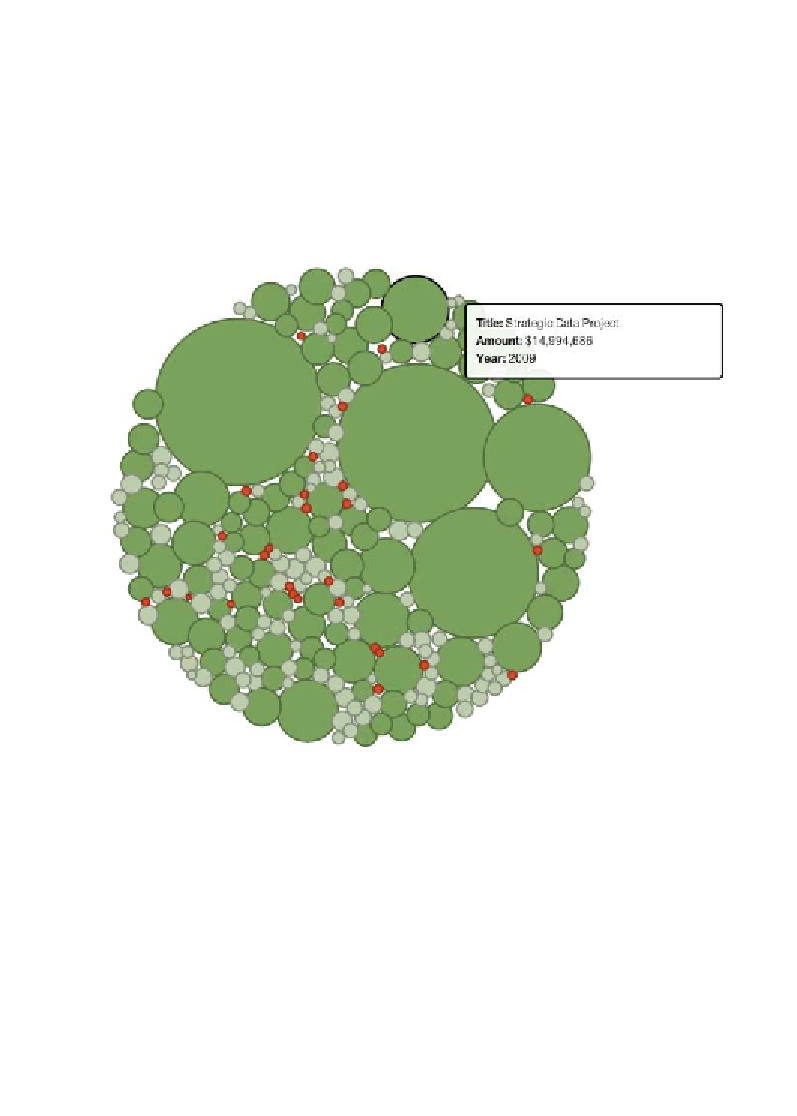
Description
: As the title suggests, this type of chart seeks to pack together constituent
circles into an overall circular layout that represents the whole. Each individual circle
represents a different category and is sized according to the associated quantitative
value. Other visual variables, such as color and position, are often incorporated to
enhance the layers of meaning of the display. Note that you can't tessellate circles
and so the combined view never creates a perfect fit (there are always gaps). The
algorithms used to form the arrangement will often utilize certain overlapping
properties to maintain the accuracy of the respective part-to-whole area sizes.
Image from "Gates Foundation Educational Spending" (
http://vallandingham.me/vis/gates/
),
created by Jim Vallandingham
Bubble hierarchy
Data variables
: Multiple x categorical, 1 x quantitative-ratio.
Visual variables
: Area, position, color-hue.
Search WWH ::

Custom Search