Graphics Reference
In-Depth Information
Description
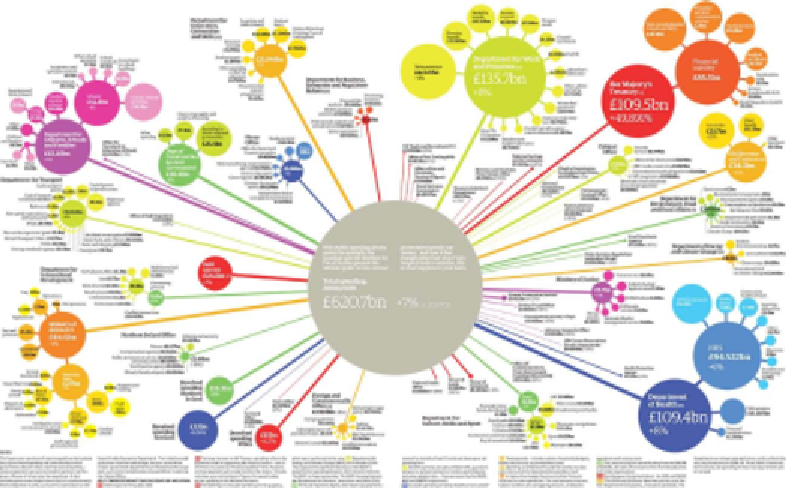
: This technique is used to portray organization and structure through a
hierarchical display. In the following example, we see the use of circles to represent
the constituent departments, sized according to their quantitative value and colored
to visually distinguish the different departments.
Image from "UK public spending by government department, 2008/09" (
http://www.guardian.co.uk/
news/datablog/2010/may/17/uk-public-spending-departments-money-cuts
),
created by Michael Robinson and Jenny Ridley for the Guardian
Tree hierarchy
Data variables
: 2 x categorical, 1 x quantitative-ratio.
Visual variables
: Angle/area, position, color-hue.
Description
: Similar to the bubble hierarchy, this technique presents the organization
and structure of data through a hierarchical tree network. In the following example,
portraying the structure of a topic, the effect is quite abstract but every visual
property is serving the purpose of representing just the data - the quantitiative
properties and hierarchical arrangement of all the topic's elements:


Search WWH ::

Custom Search