Biomedical Engineering Reference
In-Depth Information
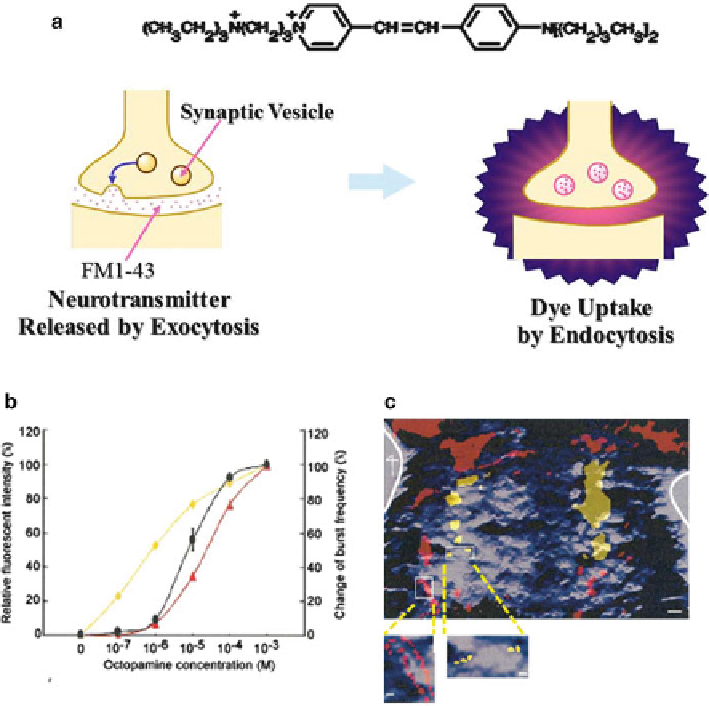
Fig. 6.5
Functional synaptic visualization with FM1-43. (
a
) Mechanism for staining the active
presynaptic terminal with FM1-43. (
b
) Dose dependence of the relative fl uorescence intensity as a
function of octopamine concentration. Two-response patterns were observed. One group of spots
(high affi nity;
diamonds
) responds to low concentrations of octopamine and saturates at 10
−5
to
10
−4
M. The other group (low affi nity;
triangles
) responds to octopamine concentrations in excess
of 10
−5
M and saturates at 10
-4
to 10
−3
M, in a manner similar to the motor pattern response (
cir-
cles
). The
bar
indicates S.D. (
c
) The
yellow areas
indicate the FM1-43 fl uorescent spots with a
high affi nity to octopamine. The
red areas
indicate low-affi nity regions. The
blue background
is
the inverted ww-781 fl uorescence image. Scale bar = 5
μ
m. The
arrowhead
indicates the anterior
side (modifi ed from Mizutani et al. (
2003
) )
at 5-10
m from the edge of the VNC, between the fi rst and second/third lateral
nerves and the center of the VNC (Fig.
6.5c
, red area). We magnifi ed the red and
yellow fl uorescent spots in the rectangular areas of Fig.
6.5c
by a factor of three and
show the area with a higher fl uorescence intensity in Fig.
6.5c
. In this way, bright
fl uorescent FM1-43 spots of 1-2
μ
μ
m in diameter were observed on the cell membrane
of neuronal cell bodies.