Biomedical Engineering Reference
In-Depth Information
140
100
(ppm)
(a)
60
140
100
60
(ppm)
(b)
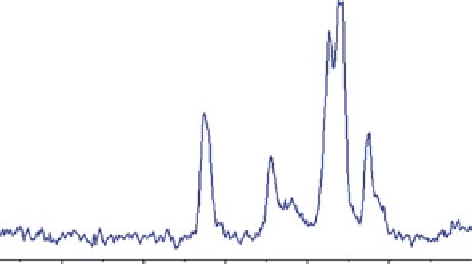
Figure8.8
13
CCP/MASNMRspectrumofcellulose(a)fiber(wholecells)and(b)microfibers
afterhydrolysis.
to obtain a sufficiently large signal to noise ratio that would justify such curve fit-
ting. However, after hydrolysis of the cellulose fibers, we observe that the signal
attributed to the crystalline regions at around 89 ppm is sharper and far better defined
(Figure 8.9b). Moreover, the ratio of the peak intensities for the crystalline region
to that of the amorphous region also increases significantly with hydrolysis. This
observation agrees with our model of cellulose hydrolysis in which the accessible
amorphous and surface regions react before the crystalline interiors. The increase in
both intensity and sharpness of the C4 crystalline component peak clearly indicates
that we were successfully able to eliminate the amorphous and disordered domains
leaving behind collections of well-defined crystalline microfibrils.
2. The C6 signal appearing at 63 ppm had a well-defined shoulder that has normally
been attributed to the amorphous component in cellulose. We find that the hydrolytic
treatment of the whole cellulose fibers resulted in the main C6 peak becoming sharper.

Search WWH ::

Custom Search