Environmental Engineering Reference
In-Depth Information
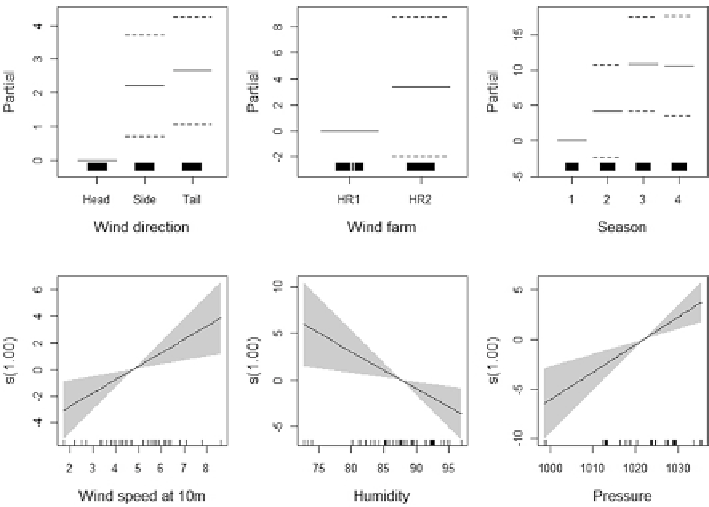
Fig. 3
Response curves of the GAMM for the northern gannet displaying the relationship between
the flight altitude and predictor variables. The values of the environmental predictors are shown on
the X-axis and the probability on the Y-axis in logit scale. The degree of smoothing is indicated in
the title of the Y-axis. The
shaded areas
and the
dotted lines
show the 95 % Bayesian confidence
intervals
conditions (in our data set) well below rotor height during all wind directions.
The flight height was slightly higher in tail winds in comparison to head winds.
Aerial surveys revealed very high densities of common scoters within the investigated
wind farm areas including a three km buffer zone, and ship survey results indicated
that about 1 % of all common scoters were recorded in flight (n = 11,948). In total
434 common scoter tracks were observed by the radar and 344 with the rangefinder.
Of these, 184 birds entered the wind farm area resulting in 76 % macro avoidance
rate. However, due to a constant presence of high densities, a high flux of birds was
estimated through the wind farms, and collision rates were estimated at 8-31/45-178
birds per wind farm (HR1/HR2) per year (Table
4
).
Landbirds (Migrating Bird Model)
As an example of the results for landbirds red kite
Milvus milvus
was selected from
a post-construction study in Fehmarn Belt, Baltic Sea (Fig.
1
). The GAMM flight
model for the red kite at the Rødsand 2 coastal wind farm, located where the birds