Environmental Engineering Reference
In-Depth Information
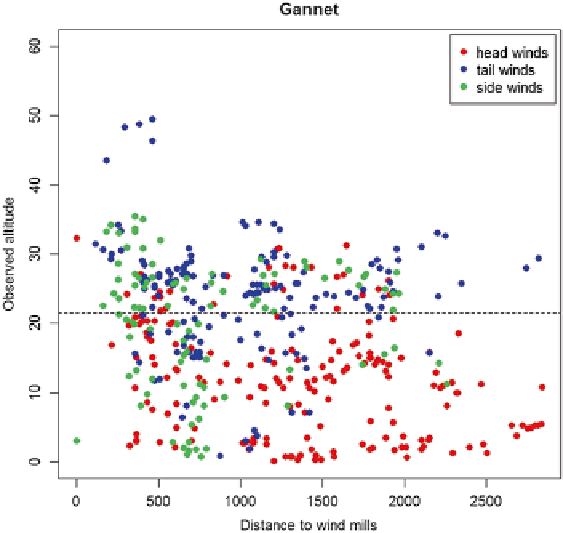
Fig. 2
Observed altitude plotted against distance to closest wind turbine for northern gannets at
Horns Rev. The different colors indicate head winds (
red
), tail winds (
blue
) and side winds (
green
).
The rotor height (
lowest tip
) of the turbines at Horns Rev 2 is indicated with a
dashed black line
during tail winds and side winds and just below in head winds (Fig.
4
). In total, 26
northern gannet tracks were observed using the radar and 46 using the rangefinder.
Of these, 10 birds entered the wind farm area resulting in 86 % macro-avoidance
rate. A relatively high proportion of all northern gannets were recorded flying at
rotor altitude (8.7-39.1 %). Collision risk estimates indicated that due to low
densities of northern gannets in the study area no or very few northern gannets were
expected to collide with the investigated wind farms (Table
2
).
The GAMM flight model for the common scoter indicated that the birds fly
higher in tail and side winds in comparison to head winds (Table
3
, Figs.
5
and
6
).
They also seem to increase flight height closer to the wind turbines, as well as with
increasing wind speed and relative humidity. The model had a reasonable predictive
ability with a Spearman's correlation coefficient of 0.30 when the model was fitted
on 70 % of the data and evaluated on 30 %. The adjusted R
2
value indicated that the
model explained 10 % of the variability in the data set. We did not find spatial
autocorrelation in the model residuals of the random effects, which indicated that
the GAMM model was able to account for the spatial autocorrelation in the data.
We used the model for predicting the average flight altitudes of the common
scoters (Fig.
7
). According to the predictions the common scoters flew in mean