Graphics Reference
In-Depth Information
Figure
.
.
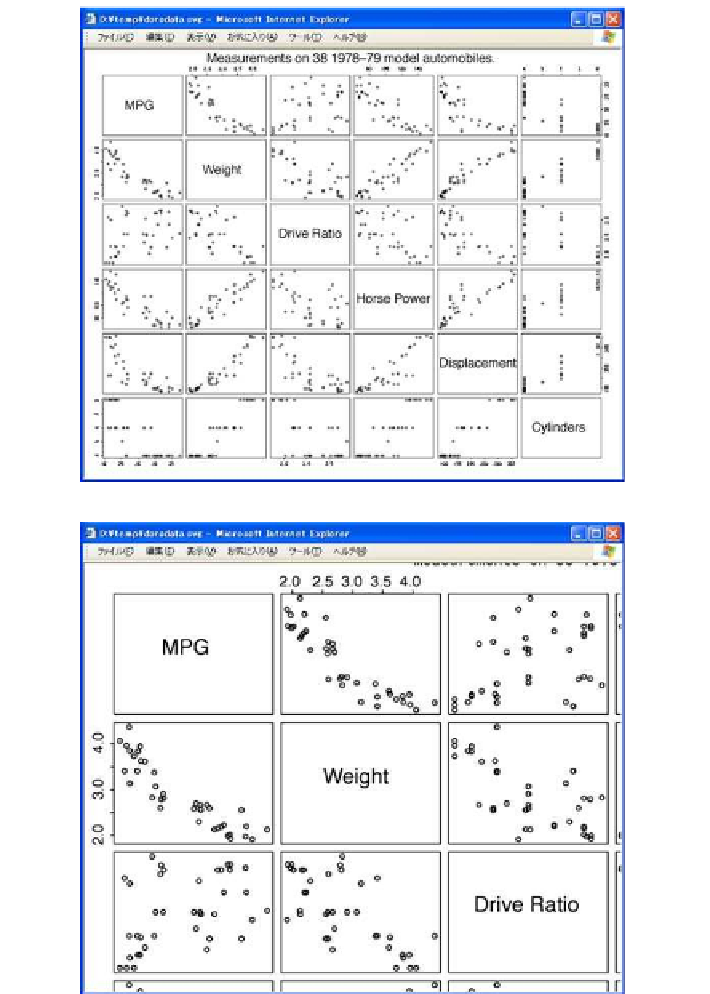
A scatter plot matrix created by RSvgDevice
Figure
.
.
Close-up of the scatter plot matrix
per gallon as measured by a consumers' union on a test track and other values re-
ported by the automobile manufacturer. he measurements comprise six variables
in all, making it di
cult to comprehend Fig.
.
, but Fig.
.
gives clearer infor-
mation.