Graphics Reference
In-Depth Information
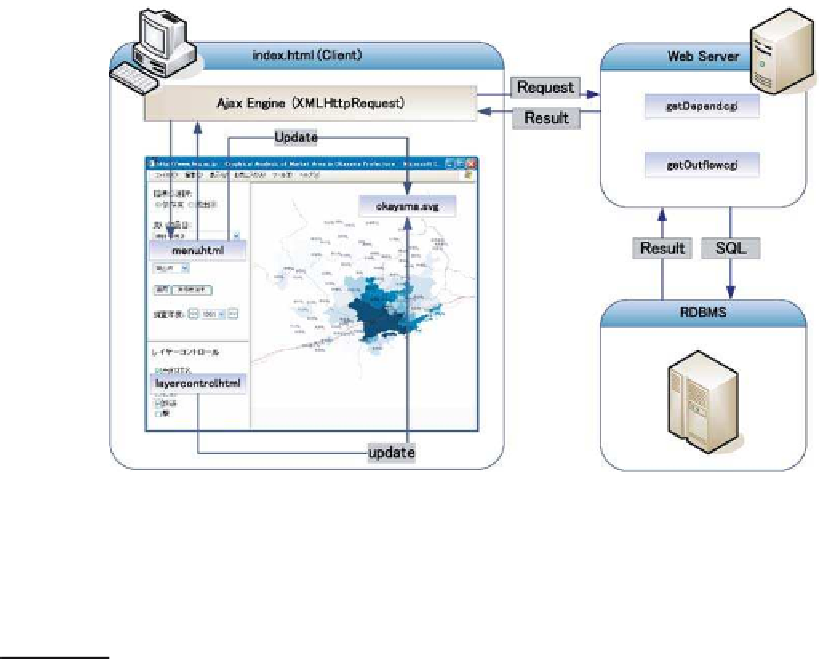
Figure
.
.
Structure of the Okayama market area analysis system
data that are needed to draw a choropleth map. A choropleth map is then created by
calling the
fillColor
function with these data as its argument.
Authoring Tool for SVG Statistical Graphics in R
18.5.4
RSvgDevice
R (R Project,
) is one of the most popular open source sotware packages and
is supported by numerous statisticians. R can output various statistical graphs. he
libraryRSvgDevice(Luciani,
),developedforRbyT.JakeLuciani,can treat SVG
as a graphic device (as well as devices such as postscript and pdf) in R. Using this li-
brary, the usercan generate astatistical graph inSVG format usingthe R commands.
Even if the user has no knowledge of the SVG format, the user can benefit from the
advantages of SVG by presenting the generated SVG files on the Web or by investi-
gating the effectsofsmallmodifications madeusingatexteditor.Forexample,itmay
not be realistic to describe all of the parts of a scatter plot using SVG in a text editor,
but using RSvgDevice, we can create the plot by simply changing the graphic device
to SVG using R command
devSVG
.
In this way, we can obtain the SVG output as shown in Fig.
.
. here is little
changeinthelaborrequiredtoinputthecommandthat outputsthegraphics inother
devices. In addition, we can immediately use functions such as expansion, reduction
and movement, as shown in Fig.
.
.
he data is the Cars data from DASL (DASL Project,
), which are measure-
ments from
-
model automobiles, specifically the gas mileage in miles