Graphics Reference
In-Depth Information
mensions. Grand tours (Asimov,
) are sometimes undertaken in the hope of
extracting high-dimensional data structure by rotating randomly projected three-
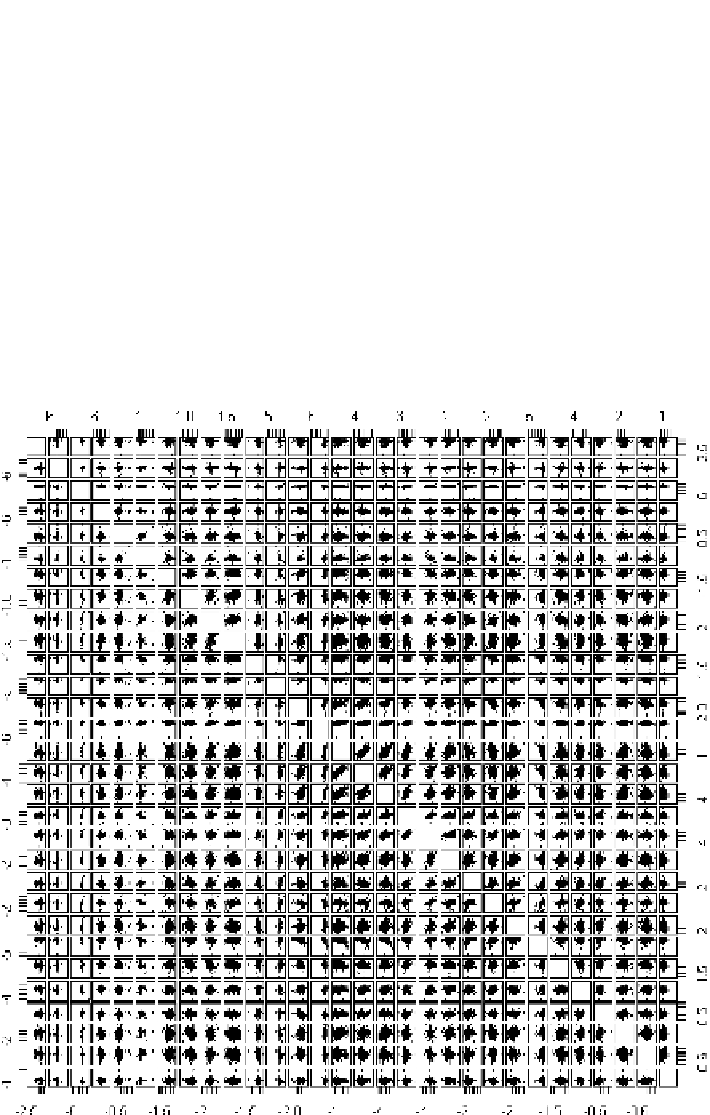
dimensional plots. Dimension reduction techniques, such as principal component
analysis, arealsouseful fordisplayingstructural information fromhigh-dimensional
data in low-dimensional displays. Figure
.
shows a scatterplot matrix display of
the first
variables (arrays) in Dataset
, while Fig.
.
gives the corresponding
PCP forthese data. Wenote that aPCP of high-dimensional data with a large sample
size can simultaneously display all of the samples, but it is usually necessary to use
someinteractive mechanismtoselectsubsets ofsamples inordertostudytherelative
structure across all variables, asin Fig.
.
.Moreover, forthese plots, morethan one
pixel width is needed to display each variable.
In general, a scatterplot matrix needs C
n dots to display a dataset with n
samples measured on p variables, a PCP needs p vertical lines plus
(
p,
)
(
p
−
)
n line
segments, and an MV plot requires n
p dots. When p becomes large, larger than
Figure
.
.
Scatterplot matrix for the first thirty arrays of Dataset