Graphics Reference
In-Depth Information
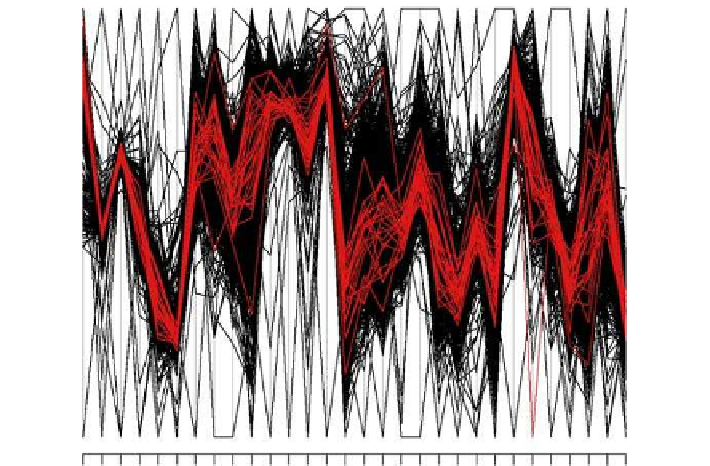
Figure
.
.
Parallel coordinates plot for the first thirty arrays of Dataset
for instance, a scatterplot matrix is basically useless. A PCP display does well for up
toafewhundredvariables, butfoundersformoreduetothespacerequiredtodisplay
the line segments that connect sample points. A scatterplot matrix also wastes a high
proportion of the display space. An MV display, on the other hand, utilizes every
column pixel to display a variable on a computer screen. PCP has an advantage over
MV on the sample side, but MV plots provide better resolution.
Overall Eiciency
Figure
.
is a diagram of e
ciency against dimensionality for a conventional scat-
terplot (matrix) and dimension-free visualization tools such as the parallel coordi-
natesplot(PCP)andmatrixvisualization(MV).Whiledirectvisualperceptionofthe
geometric pattern makes scatterplots the moste
cient typeof displayforvisualizing
low-dimensional data, MVand PCParedefinitely betterforvisualizing datasets with
fiteen or more variables.
Missing Values
It is very di
cult to display missing values in a scatterplot, while it is always possi-
ble to display missing values above or below the regular data range of each variable
in a PCP display. he MANET system by Unwin et al. (
) can be used to dis-
play missing information interactively. In an MV plot, a missing value can be simply
displayed at the corresponding position (row and column) with a color that can be
easily distinguished from the color spectrum of the numerical values. he missing
values of the gene expression profiles in Figs.
.
and
.
are coded in white. With
appropriate permutations for rows and columns, the corresponding variable-sample