Graphics Reference
In-Depth Information
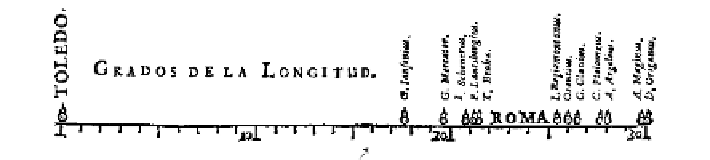
Figure
.
.
Langren's
graph of determinations of the distance, in longitude, from Toledo to Rome.
he correct distance is
′
. Source:Tute(
,p.
)
areliable means to determine longitude at sea hindered navigation and exploration.
his
-D line graph shows all
known estimates of the difference in longitude be-
tween Toledo and Rome and the name of the astronomer (Mercator, Tycho Brahe,
Ptolemy, etc.) who provided each observation.
What is notable is that van Langren could have presented this information in var-
ious tables - ordered by author to show provenance, by date to show priority, or by
distance. However, only a graph shows the wide variation in the estimates; note that
the range of values covers nearly half the length of the scale. Van Langren took as his
overall summary the centre of the range, where there happened to be a large enough
gap for him to inscribe 'ROMA.' Unfortunately, all of the estimates were biased up-
wards; the true distance (
′
) is shown by the arrow. Van Langren's graph is also
amilestone astheearliest knownexemplar of theprincipleof'effectorderingfordata
display' (Friendly and Kwan,
).
In the
s, the systematic collection and study of social data began in various
European countries, underthe rubricof 'political arithmetic' (John Graunt,
and
William Petty,
), with the goals of informing the state about matters related to
wealth, population, agricultural land, taxes and so forth,
as well as for commercial
purposes such as insurance and annuities based on life tables (Jan de Witt,
). At
approximatelythesametime,theinitial statements ofprobability theoryaround
(see Ball,
) together with the idea of coordinate systems were applied by Chris-
tiaan Huygens in
to give the first graph of a continuous distribution function
(from Graunt's based on the bills of mortality). he mid-
s saw the first bivariate
plot derived from empirical data, a theoretical curve relating barometric pressure to
altitude, and the first known weather map,
showing prevailing winds on a map of
the earth (Halley,
).
Bytheendofthiscentury,thenecessaryelementsforthedevelopmentofgraphical
methods were at hand - some real data of significant interest, some theory to make
For navigation, latitude could be fixed from star inclinations, but longitude required ac-
curate measurement of time at sea, an unsolved problem until
with the invention of
a marine chronometerby John Harrison. See Sobel (
) for a popular account.
For example, Graunt (
) used his tabulations of London births and deaths from parish
records and the bills of mortality to estimate the number of men the king would find avail-
able in the event of war (Klein,
, pp.
-
).
Image: http://math.yorku.ca/SCS/Gallery/images/huygens-graph.gif
Image: http://math.yorku.ca/SCS/Gallery/images/halleyweathermap-
.jpg