Graphics Reference
In-Depth Information
ing, map making, navigation and territorial expansion. his century also saw great
new growth in theory and the dawn of practical application - the rise of analytic
geometry and coordinate systems (Descartes and Fermat), theories of errors of mea-
surement and estimation (initial steps by Galileo in the analysis of observations on
Tycho Brahe's star of
(Hald,
,§
.
)),the birth of probability theory (Pascal
and Fermat) and the beginnings of demographic statistics (John Graunt) and 'politi-
cal arithmetic' (William Petty) - the study of population, land, taxes, value of goods,
etc. for the purpose of understanding the wealth of the state.
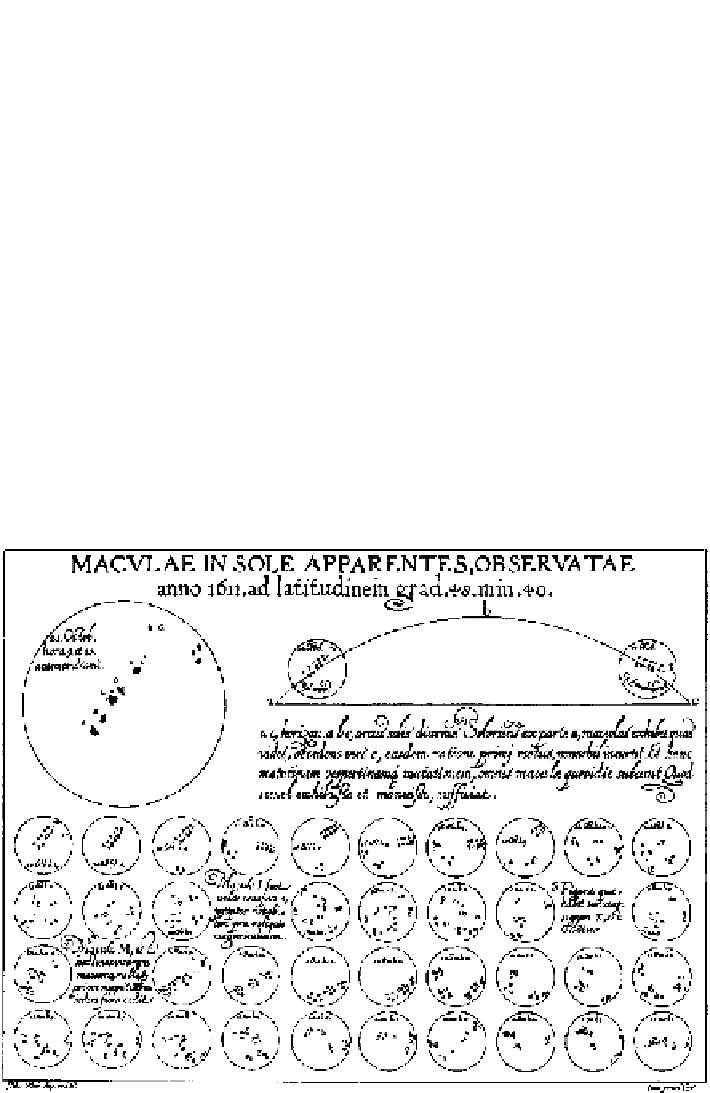
Early in this century, Christopher Scheiner (
-
, recordings from
) in-
troduced an idea Tute (
) would later call the principle of 'small multiples' to
show the changing configurations of sunspots over time, shown in Fig.
.
. he mul-
tipleimagesdepicttherecordings ofsunpots from
October
until
December
of that year. he large key in the upper let identifies seven groups of sunspots by the
letters A-G. hese groups are similarly identified in the
smaller images, arrayed
let to right and top to bottom below.
Another noteworthy example (Fig.
.
) shows a
graphic by Michael Florent
van Langren[
-
], a Flemish astronomer to the court of Spain, believed to be
thefirstvisualrepresentationofstatisticaldata(Tute,
,p.
).Atthattime,lackof
Figure
.
.
Scheiner's
representation of the changes in sunspots over time. Source:Scheiner
(
-
)