Graphics Reference
In-Depth Information
(
)distinguish three different strategies of exploration: replacement, overlay, and
replication.
Replacement
8.3.1
In the replacement mode, old information is typically lost and gets replaced by new
information. While this strategy is reasonable for plot parameters, it is rather useless
for the subsetting and conditioning approach because the important information on
the marginal distributions is lost. It only works fine when we have individual plot
symbols for each observation, as in scatterplots for example, where some attributes
are changed by the user interaction. But even when replacing plot parameters the
user loses the possibility to compare the current plot with previous versions. he
user can only compare the current image with a mental copy of the previous image
and hence the comparison might get distorted. Especially in the exploratory stage of
data analysis for which interactive graphics are designed, it is helpful to keep track of
changing scenarios and the different plot versions. A history system that stores the
history of plot changes as they are implemented in some geovisualization systems
(Roberts,
) is very helpful.
Overlaying
8.3.2
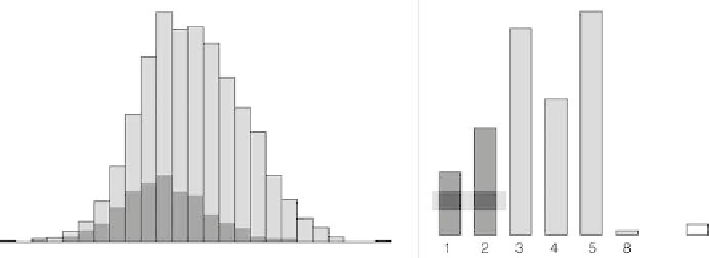
In the realm of direct manipulation graphics, overlaying is the typical strategy when
looking at conditional distributions in area plots. In Fig.
.
a histogram is linked to
a barchart. he two classes to the let of the barchart are selected and a histogram
for these data points is overlaid on the original plot. he representation of the con-
ditional distribution inherits the plot parameters of the original plot. his eases the
comparison between the conditional distribution and the marginal distribution. It
also provides a common framework for a comparison of two conditional distribu-
tions if the user changes the selection of the conditioning set.
Figure
.
.
Two categories in the barchart are selected. his selection is propagated to the histogram in
which a histogram representing the selected subset is overlaid. he overlaid histogram uses the same
axis, scale, and plot parameters as the original display and hence establishes comparability between the
subgroup and the total sample