Graphics Reference
In-Depth Information
Figure
.
.
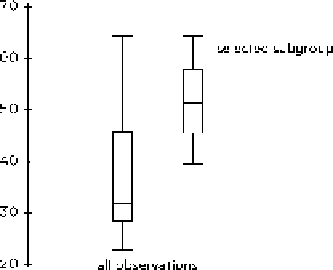
Overlaying a boxplot for the selected group covers part of the graphical elements of the
original box plot. To minimize the confusion and the loss of information, a slightly different style is
used for drawing the subgroup boxplot
Overlaying creates two kindsof problems:the oneisabasic restriction inthe free-
dom of parameter choice for the selected subset since the plot parameters are inher-
ited from the original plot; the other is the problem of occlusion or overplotting.
Part of the original display might become invisible due to the fact that the new plot
is overlaid. his can occur in particular when the data representing objects on the
type level differ substantially for the subset and the total sample. While this problem
might not be present for most area-based displays and while it is rather unimportant
for scatterplots, it is essential for more complex plots such as boxplots (Fig.
.
).
Repetition
8.3.3
Repetition is the third strategy of visualizing linked interactions. Here, the displays
are repeated and different views of the same data are available at the same time. he
advantage is a rather comprehensive picture of the data; the user has a complete
overview on all different representations and can clearly observe the impact of pa-
rameter changes and other user interactions. he disadvantage is that the user might
get lost in the multitude of slightly changed and adapted views. he repetition strat-
egy requires an easy way to keep track of the various changes and adaptations that
have been issued by the user. It also requires an easy and powerful system to arrange
the displays on a computer screen. A condensed form of the repetition strategy that
works very well for the purpose of subsetting is juxtaposition. his means placing
the plot for the selected subgroup not directly on top of the original plot but close
to it to the side. Juxtaposition avoids masking important features of the original plot
and still allows easy comparison between the two representations. he comparative
Figure
.
.
Instead of overlaying the plot for the selected subgroup, it is placed next to the original one
such that no overlapping occurs