Graphics Reference
In-Depth Information
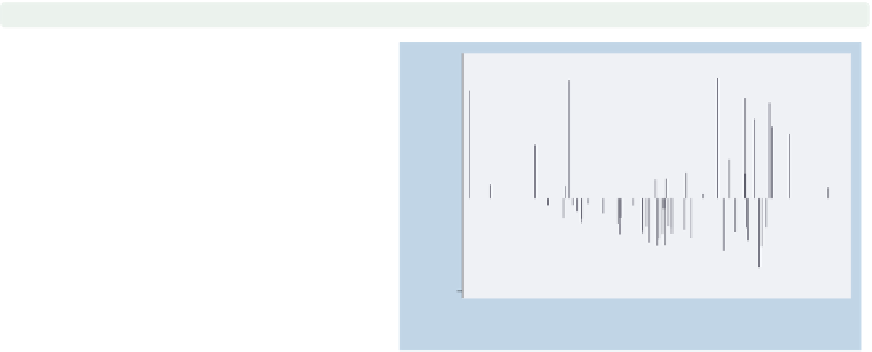
twoway
spike
r yhat
This same graph could be shown using
the
spike
command. This produces a
spike plot, and each spike, by default,
originates from 0.
Uses allstates.dta & scheme vg blue
60
40
20
0
−20
−40
0
20
40
60
yhat propval100|urban
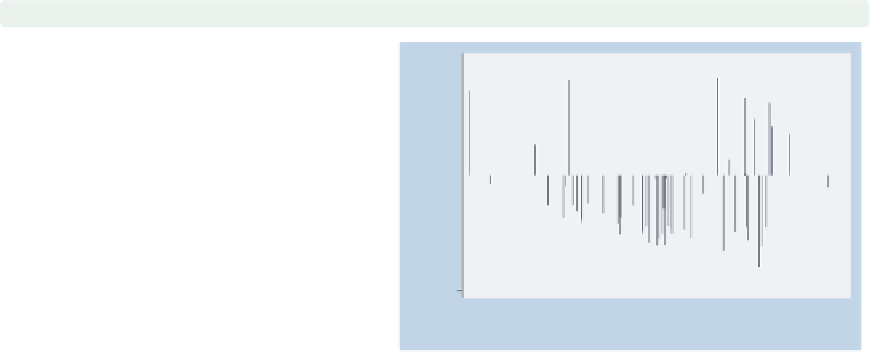
twoway
spike
r yhat,
blcolor(navy) blwidth(thick)
You can use the
blcolor()
(bar line
color) option to set the color of the
spikes and the
blwidth()
(bar line
width) option to set the width of the
spikes. Here, we make the spikes thick
and navy. See
Styles : Colors
(328) for
more details about specifying colors
and see
Styles : Linewidth
(337) for more
details about specifying line widths.
Uses allstates.dta & scheme vg blue
60
40
20
0
−20
−40
0
20
40
60
yhat propval100|urban
twoway
spike
r yhat,
base(10)
By default, the base is placed at 0,
which is a very logical choice when
displaying residuals since our interest is
in deviations from 0. For illustration,
we use the
base(10)
option to set the
base of the
60
40
20
-axis to be 10, and the
spikes are displayed with respect to 10.
Uses allstates.dta & scheme vg blue
y
0
−20
−40
0
20
40
60
yhat propval100|urban
The electronic form of this topic is solely for direct use at UCLA and only by faculty, students, and staff of UCLA.