Graphics Reference
In-Depth Information
twoway spike r yhat,
horizontal
xtitle(Title for x-axis)
ytitle(Title for y-axis)
The
spike
command supports the
horizontal
option, which swaps the
position of the
r
and
yhat
variables.
Note that the
60
x
-axis still remains at the
40
bottom and the
y
-axis still remains at
the left.
Uses allstates.dta & scheme vg blue
20
0
−40
−20
0
20
40
60
Title for x−axis
twoway
dropline
r yhat,
msymbol(Oh)
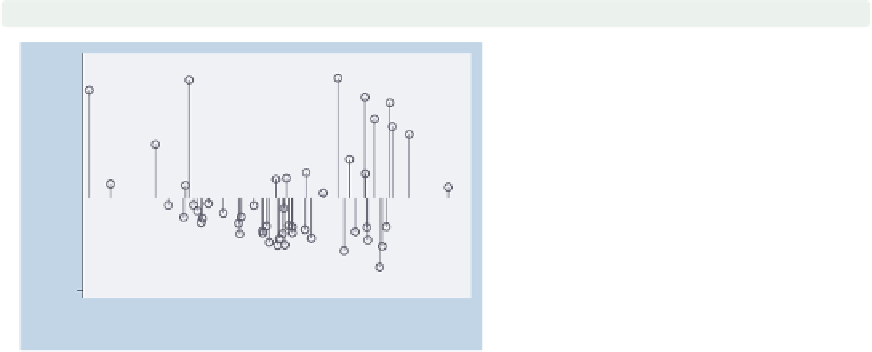
A
twoway dropline
plot is much like a
spike
plot but permits a symbol, as
well. It supports the
horizontal
,
base()
,
blcolor()
,and
blwidth()
options just like
twoway spike
, so these
are not illustrated. But you can use
marker symbol options to control the
symbol. Here, we add the
msymbol(Oh)
option to obtain hollow circles as the
symbols; see
Options : Markers
(235) for
more details.
Uses allstates.dta & scheme vg blue
60
40
20
0
−20
−40
0
20
40
60
yhat propval100|urban
twoway dropline r yhat, msymbol(O)
msize(vlarge)
mfcolor(gold) mlcolor(olive) mlwidth(thick)
Here, we make the symbols very large
circles and use
mfcolor()
to make the
marker fill color gold,
mlcolor()
to
make the marker line color olive, and
mlwidth()
to make the marker line
width thick. For more information, see
Options : Markers
(235).
Uses allstates.dta & scheme vg blue
60
40
20
0
−20
−40
0
20
40
60
yhat propval100|urban
The electronic form of this topic is solely for direct use at UCLA and only by faculty, students, and staff of UCLA.