Graphics Reference
In-Depth Information
twoway (scatter ownhome urban) (lfit ownhome urban) (qfit ownhome urban),
legend(
size(medium) color(maroon) bfcolor(eggshell) box
)
The
legend()
option permits us to
supply options that control the display
of the labels for the keys. Here, we
request that those labels be maroon,
medium in size, displayed with an
eggshell background, and surrounded
by a box.
Uses allstatesdc.dta & scheme vg s2c
20
40
60
80
100
Percent urban 1990
% who own home
Fitted values
Fitted values
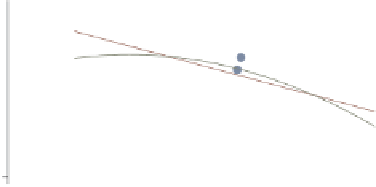
twoway (scatter ownhome urban) (lfit ownhome urban) (qfit ownhome urban),
legend(
region(fcolor(dimgray) lcolor(gs8) lwidth(thick) margin(medium))
)
The
region()
option can be used to
control the overall box in which the
legend is placed. Here, we specify the
fill color to be a dim gray, the line color
to be a medium gray
(
gs8
= gray scale 8), the line to be
thick, and the margin between the text
and the box to be medium.
Uses allstatesdc.dta & scheme vg s2c
20
40
60
80
100
Percent urban 1990
% who own home
Fitted values
Fitted values
twoway (scatter ownhome urban) (lfit ownhome urban) (qfit ownhome urban),
legend(rows(1)
bmargin(t=10)
)
We can adjust the margin around the
box of the legend with the
bmargin()
option. Here, we use
t=10
to make the
margin 10 at the top, increasing the
gap between the legend and the title of
the
-axis.
Uses allstatesdc.dta & scheme vg s2c
x
20
40
60
80
100
Percent urban 1990
% who own home
Fitted values
Fitted values
The electronic form of this topic is solely for direct use at UCLA and only by faculty, students, and staff of UCLA.


