Graphics Reference
In-Depth Information
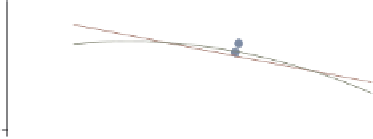
twoway (scatter ownhome urban) (lfit ownhome urban) (qfit ownhome urban),
legend(
symxsize(30) symysize(20)
)
We can control the width allocated to
symbols with the
symxsize()
option
and the height with the
symysize()
option.
Uses allstatesdc.dta & scheme vg s2c
20
40
60
80
100
Percent urban 1990
% who own home
Fitted values
Fitted values
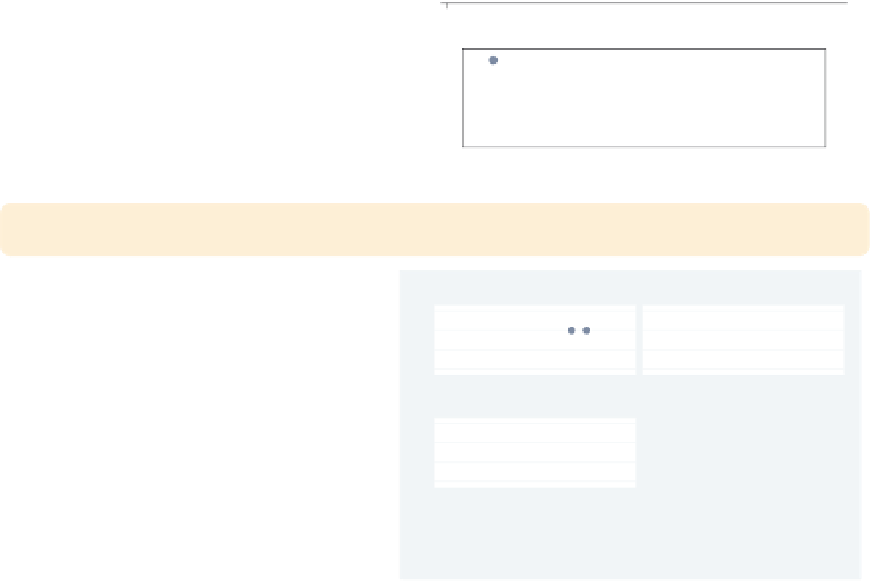
twoway (scatter ownhome urban) (lfit ownhome urban) (qfit ownhome urban),
legend(
colgap(20) rowgap(20)
)
We can control the space between
columns of the legend with the
colgap()
option and the space between
the rows with the
rowgap()
option.
Note that the
rowgap()
option does
not affect the border between the top
row and the box or the border between
the bottom row and the box.
Uses allstatesdc.dta & scheme vg s2c
20
40
60
80
100
Percent urban 1990
% who own home
Fitted values
Fitted values
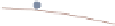
twoway (scatter ownhome urban) (qfit ownhome urban),
by(nsw)
Consider this graph, which shows two
overlaid scatterplots shown separately
by the location of the state. We will
explore how to modify the legend for
this kind of graph.
Uses allstatesdc.dta & scheme vg s2c
North
South
40
60
80
100
West
40
60
80
100
Percent urban 1990
% who own home
Fitted values
Graphs by Region North, South, or West
The electronic form of this topic is solely for direct use at UCLA and only by faculty, students, and staff of UCLA.