Graphics Reference
In-Depth Information
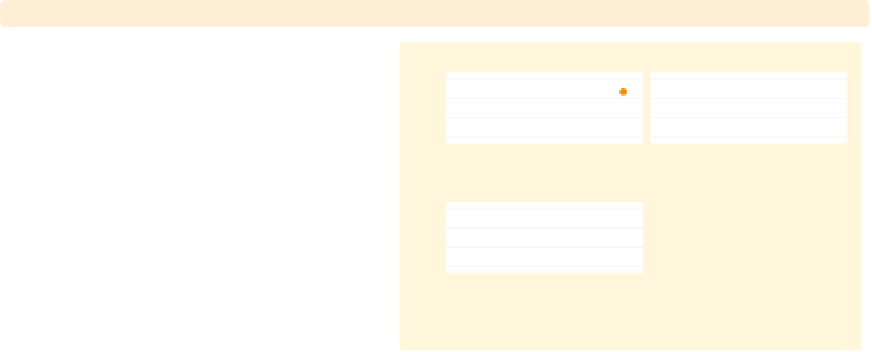
twoway scatter ownhome borninstate, by(north, total
ixaxes ixtitle
)
Likewise, we can display the
-title on
each graph using the
ixaxes
and
ixtitle
options.
Uses allstatesdc.dta & scheme vg brite
x
S & W
North
20
40
60
80
20
40
60
80
% born in state of residence
% born in state of residence
Total
20
40
60
80
% born in state of residence
% born in state of residence
Graphs by Region North or Not
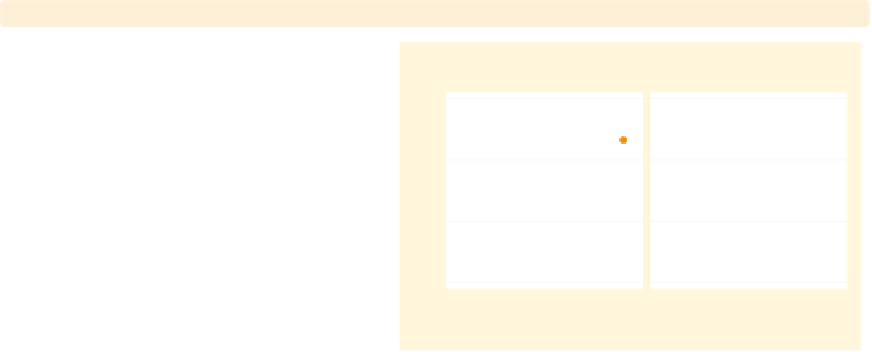
twoway scatter ownhome borninstate, by(north)
title("My title")
If we include a
title()
option with
by()
, Stata creates each graph
separately using the title we specify.
Uses allstatesdc.dta & scheme vg brite
My title
My title
S & W
North
20
40
60
80
20
40
60
80
% born in state of residence
Graphs by Region North or Not
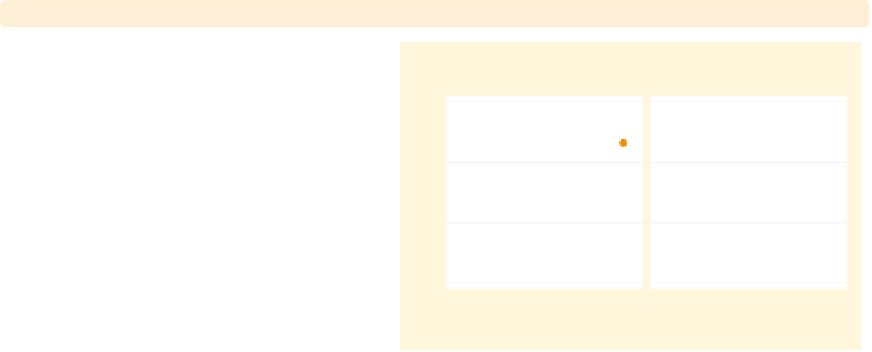
twoway scatter ownhome borninstate, by(north,
title("My title")
)
If we make the
title()
an option
within the
by()
option, Stata will make
this an overall title for the graph.
Uses allstatesdc.dta & scheme vg brite
My title
S & W
North
20
40
60
80
20
40
60
80
% born in state of residence
Graphs by Region North or Not
The electronic form of this topic is solely for direct use at UCLA and only by faculty, students, and staff of UCLA.