Graphics Reference
In-Depth Information
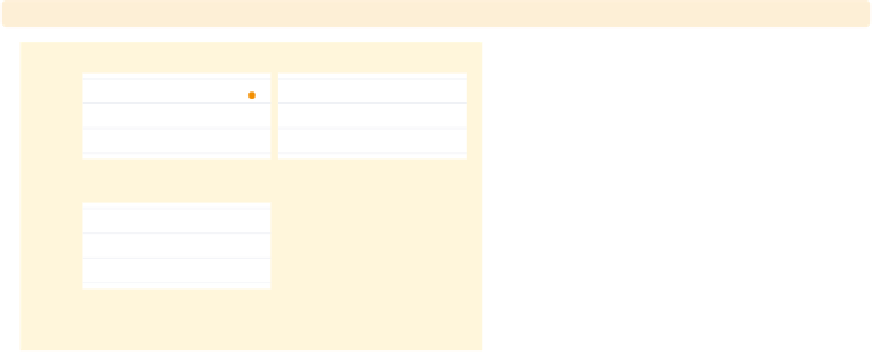
twoway scatter ownhome borninstate, by(north,
ixaxes
cols(1))
We now include the
ixaxes
option and
see that the
S & W
-axis is now displayed on
the top graph.
Uses allstatesdc.dta & scheme vg brite
x
20
40
60
80
North
20
40
60
80
% born in state of residence
Graphs by Region North or Not
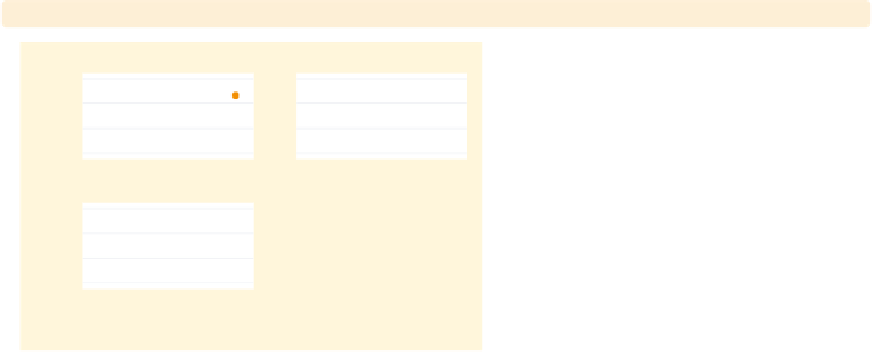
twoway scatter ownhome borninstate, by(north, total
iytitle
)
y
We can display the title for each
-axis
S & W
North
using the
iytitle
option.
Uses allstatesdc.dta & scheme vg brite
20
40
60
80
Total
20
40
60
80
% born in state of residence
Graphs by Region North or Not
twoway scatter ownhome borninstate, by(north, total
iyaxes iytitle
)
y
Note that the
-title is not displayed for
the North since the
S & W
North
y
-axis is omitted for
that graph. If we include the
iyaxes
and
iytitle
options, the
y
-axis and
y
-title are displayed for that graph as
well.
Uses allstatesdc.dta & scheme vg brite
20
40
60
80
Total
20
40
60
80
% born in state of residence
Graphs by Region North or Not
The electronic form of this topic is solely for direct use at UCLA and only by faculty, students, and staff of UCLA.