Graphics Reference
In-Depth Information
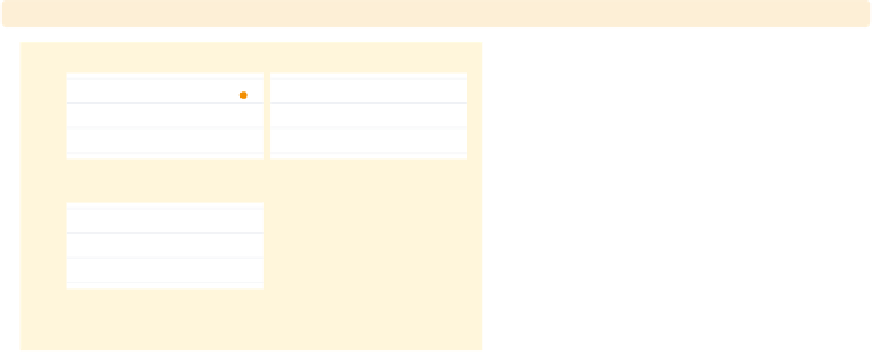
twoway scatter ownhome borninstate, by(north, total
colfirst
)
We can add the
colfirst
option to
show the graphs going down columns
first rather than going across rows first,
which is the default.
Uses allstatesdc.dta & scheme vg brite
S & W
Total
20
40
60
80
North
20
40
60
80
% born in state of residence
Graphs by Region North or Not
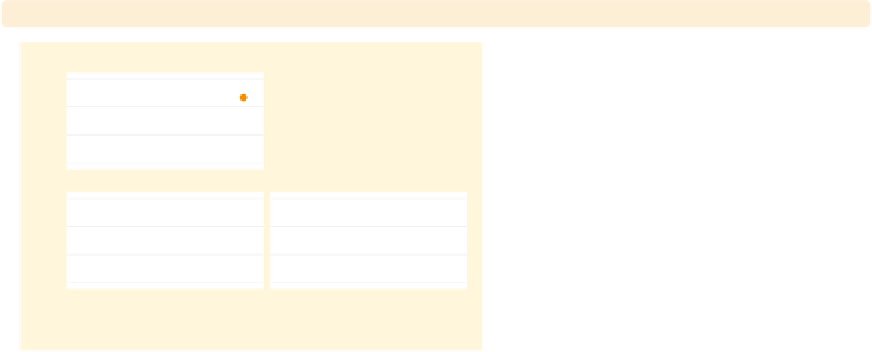
twoway scatter ownhome borninstate, by(north, total
holes(2)
)
The
holes(2)
option leaves the second
position empty. Here, we specify a
single position to leave empty, but you
can specify multiple positions within
the
holes()
option.
Uses allstatesdc.dta & scheme vg brite
S & W
North
Total
20
40
60
80
20
40
60
80
% born in state of residence
Graphs by Region North or Not
twoway scatter ownhome borninstate, by(north, total
rows(1)
)
The
rows(1)
option indicates that the
graph should be displayed in one row.
Uses allstatesdc.dta & scheme vg brite
S & W
North
Total
20
40
60
80
20
40
60
80
20
40
60
80
% born in state of residence
Graphs by Region North or Not
The electronic form of this topic is solely for direct use at UCLA and only by faculty, students, and staff of UCLA.