Graphics Reference
In-Depth Information
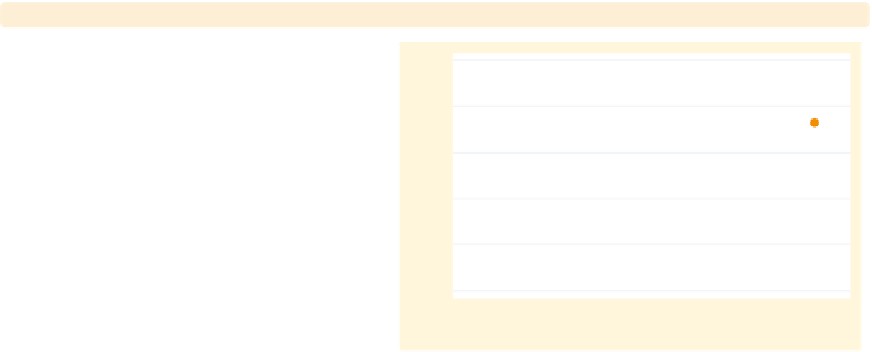
twoway scatter ownhome borninstate
We start by looking at a scatterplot of
ownhome
and
borninstate
, and we see
a general positive relationship such that
the higher the percentage of those who
were born in the state, the higher the
percentage of home owners in the state.
Uses allstatesdc.dta & scheme vg brite
20
40
60
80
% born in state of residence
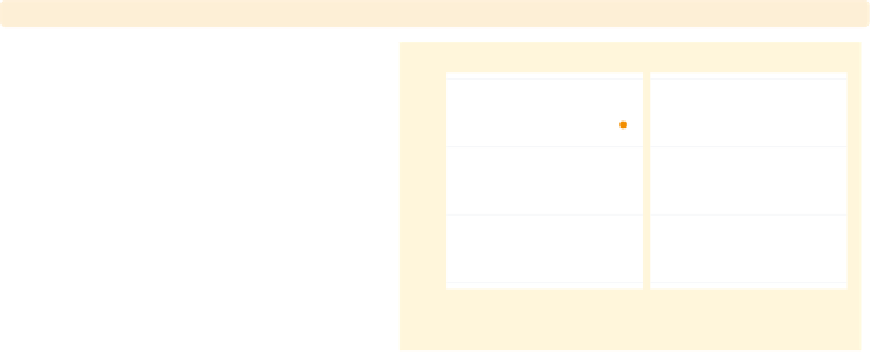
twoway scatter ownhome borninstate,
by(north)
We can use the
by(north)
option to
look at this relationship broken down
by whether the state is considered to be
in the North.
Uses allstatesdc.dta & scheme vg brite
S & W
North
20
40
60
80
20
40
60
80
% born in state of residence
Graphs by Region North or Not
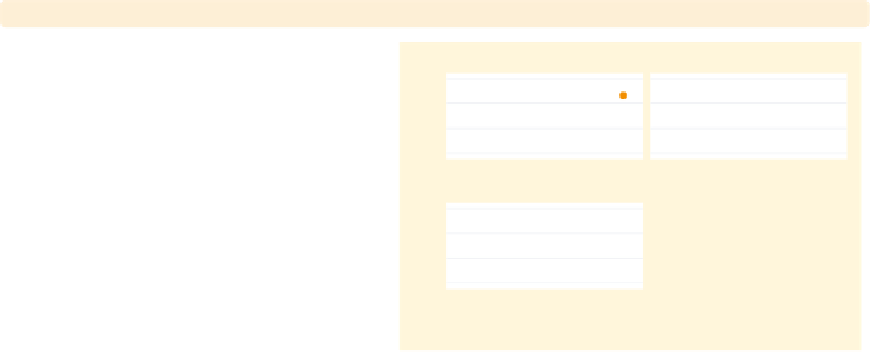
twoway scatter ownhome borninstate, by(north,
total
)
We can use the
total
option to see the
overall relationship for all 50 states, as
well as the two plots separately, by the
levels of
north
.
Uses allstatesdc.dta & scheme vg brite
S & W
North
20
40
60
80
Total
20
40
60
80
% born in state of residence
Graphs by Region North or Not
The electronic form of this topic is solely for direct use at UCLA and only by faculty, students, and staff of UCLA.