Graphics Reference
In-Depth Information
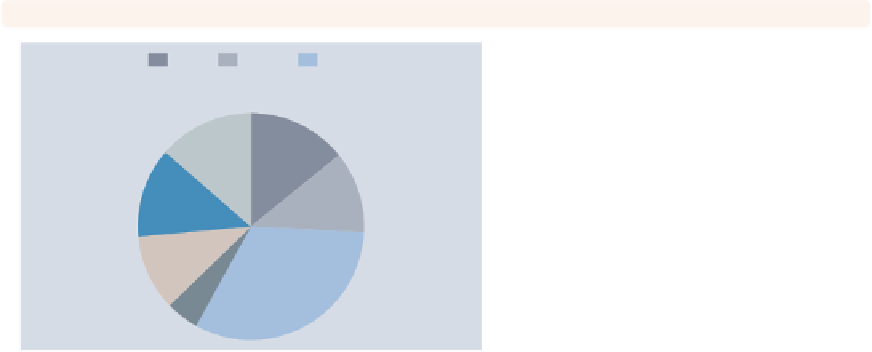
graph pie, over(occ7) plabel( all percent,
format("%2.0f")
)
When you use
plabel
to label slices
with a
sum
or
percent
, you can use the
format()
option to control the format
of the numeric values displayed. Here,
we display the percentages as whole
numbers.
Uses nlsw.dta & scheme economist
Prof
Mgmt
Sales
Cler.
Operat.
Labor
Other
14%
14%
13%
12%
11%
5%
32%
graph pie, over(occ7) plabel( all percent,
gap(-5)
)
You can use the
gap()
option to adjust
the position of the label with respect to
the center of the pie. A positive number
pushes the label away from the center
of the pie, and a negative value pushes
the label closer to the center of the pie.
Uses nlsw.dta & scheme economist
Prof
Mgmt
Sales
Cler.
Operat.
Labor
Other
13.58%
14.11%
12.73%
11.75%
10.95%
4.541%
32.32%
graph pie, over(occ7) plabel( all percent,
size(large) color(maroon)
)
You can use textbox options to modify
the display of the text labeling the pie
slices. Here, we increase the size of the
text and change its color to maroon.
See
Options : Textboxes
(303) for more
options you can use.
Uses nlsw.dta & scheme economist
Prof
Mgmt
Sales
Cler.
Operat.
Labor
Other
13.58%
14.11%
12.73%
11.75%
10.95%
4.541%
32.32%
The electronic form of this topic is solely for direct use at UCLA and only by faculty, students, and staff of UCLA.