Graphics Reference
In-Depth Information
graph pie, over(occ7)
plabel( all name, gap(-5))
plabel(1 "32%", gap(5)) legend(off)
We can include multiple
plabel()
options. In this example, the first
plabel()
option assigns the occupation
names to all the slices and moves the
names 5 units inward. The second
plabel()
option assigns text to the
second slice and displays it 5 more
units from the center. Since the legend
was not needed, we suppressed it with
the
legend(off)
option.
Uses nlsw.dta & scheme economist
32%
Other
Prof
Labor
Mgmt
Operat.
Cler.
Sales
graph pie, over(occ7)
plabel( all name, gap(-5))
plabel( all percent, gap(5) format("%2.0f"))
legend(off)
Here, we use the
plabel()
option twice
to label the slices with the occupation
name and with the percentage. We use
the
gap()
option to move the names
closer to the center by 5 extra units and
move the percentage 5 extra units from
the center.
Uses nlsw.dta & scheme economist
14%
14%
Other
Prof
13%
12%
Labor
Mgmt
Operat.
11%
Cler.
Sales
5%
32%
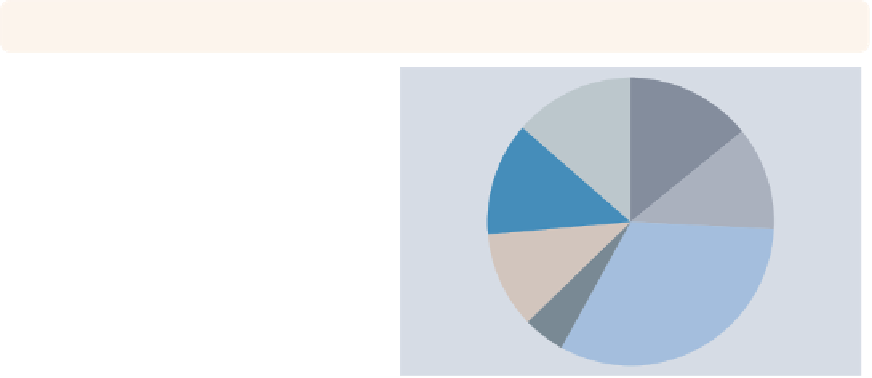
graph pie, over(occ7)
ptext(0 30 "This is some text")
The
ptext()
(pie text) option can be
used to add text to the pie chart. Polar
coordinates are used to determine the
location of the text by specifying the
angle and distance from the center.
Here, the angle is 0, and the distance
from the center is 30.
Uses nlsw.dta & scheme economist
Prof
Mgmt
Sales
Cler.
Operat.
Labor
Other
This is some text
The electronic form of this topic is solely for direct use at UCLA and only by faculty, students, and staff of UCLA.