Graphics Reference
In-Depth Information
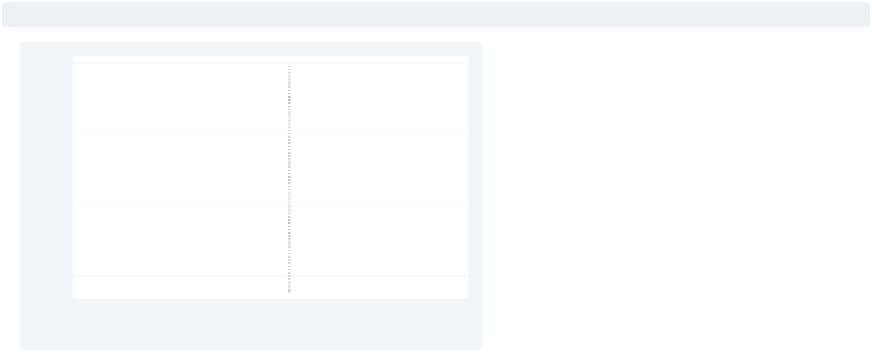
twoway
dot
close tradeday
The
dot
plot, like the
scatter
command, shows markers for each data
point but also adds a dotted line for
each of the
-values. For more details,
see
Twoway : Scatter
(35).
Uses spjanfeb2001.dta & scheme vg s2c
x
0
10
20
30
40
Trading day number
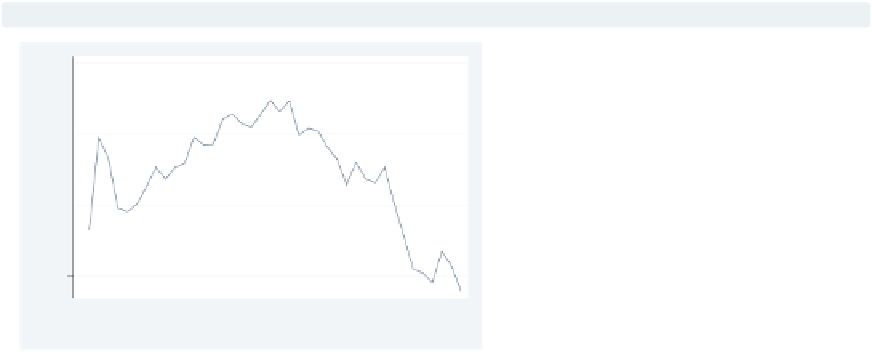
twoway
line
close tradeday, sort
The
line
command is used in this
example to make a simple line graph.
See
Twoway : Line
(54) for more details
about line graphs.
Uses spjanfeb2001.dta & scheme vg s2c
0
10
20
30
40
Trading day number
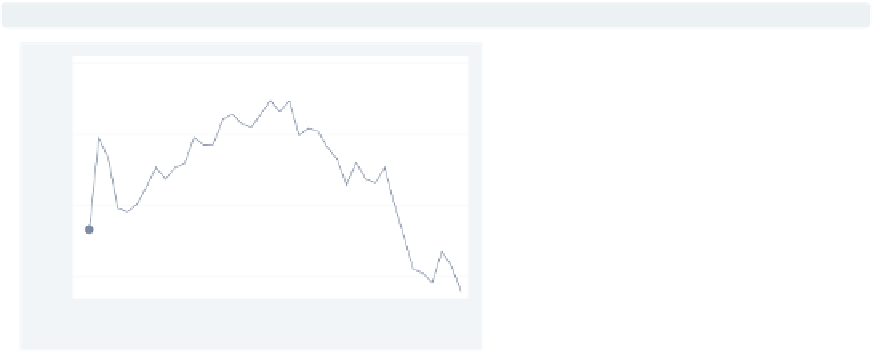
twoway
connected
close tradeday, sort
The
twoway connected
graph is similar
to
twoway line
, except that a symbol
is shown for each data point. For more
information, see
Twoway : Line
(54).
Uses spjanfeb2001.dta & scheme vg s2c
0
10
20
30
40
Trading day number
The electronic form of this topic is solely for direct use at UCLA and only by faculty, students, and staff of UCLA.