Graphics Reference
In-Depth Information
twoway (
lfitci
propval100 popden) (scatter propval100 popden)
In addition to being able to plot a fit
line, we can also plot a linear fit line
with a confidence interval using the
lfitci
command. We also overlay the
linear fit and confidence interval with a
scatterplot. See
Twoway : CI fit
(50) for
more information about fit lines with
confidence intervals.
Uses allstates.dta & scheme vg s2c
0
2000
4000
6000
8000
10000
Pop/10 sq. miles
95% CI
Fitted values
% homes cost $100K+
twoway
dropline
close tradeday
This
dropline
graph shows the closing
prices of the S&P 500 by trading day
for the first 40 days of 2001. A
dropline
graph is like a
scatter
plot
since each data point is shown with a
marker, but a dropline for each marker
is shown as well. For more details, see
Twoway : Scatter
(35).
Uses spjanfeb2001.dta & scheme vg s2c
0
10
20
30
40
Trading day number
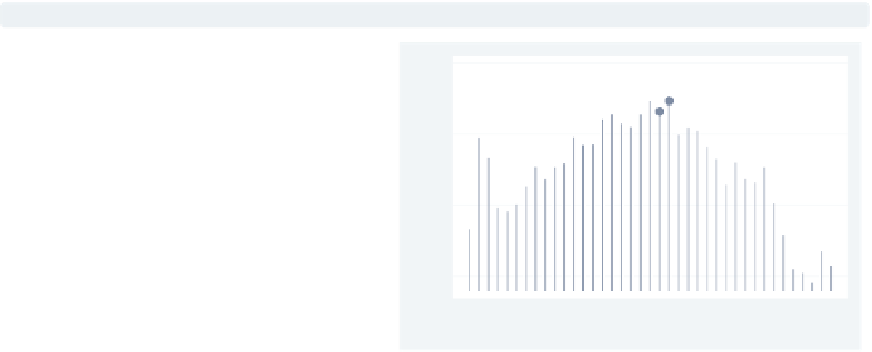
twoway
spike
close tradeday
Here, we use a
spike
graph to show the
same graph as the previous graph. It is
like the
dropline
plot, but no markers
are put on the top. For more details,
see
Twoway : Scatter
(35).
Uses spjanfeb2001.dta & scheme vg s2c
0
10
20
30
40
Trading day number
The electronic form of this topic is solely for direct use at UCLA and only by faculty, students, and staff of UCLA.