Graphics Reference
In-Depth Information
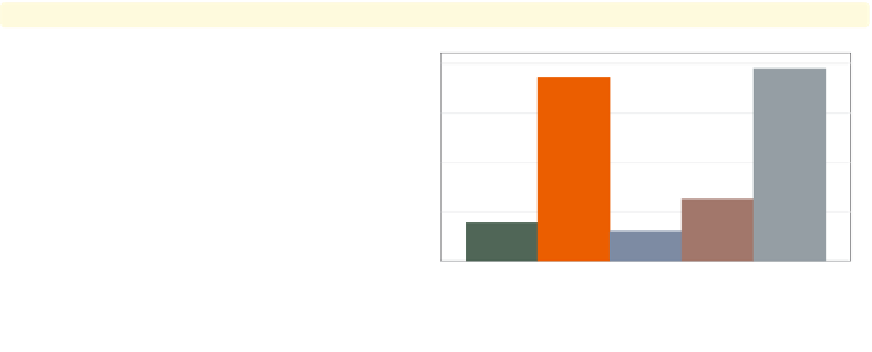
graph bar wage hours tenure ttl exp age
Consider this bar graph of five different
y
-variables. The bars for the different
y
-variables are shown with different
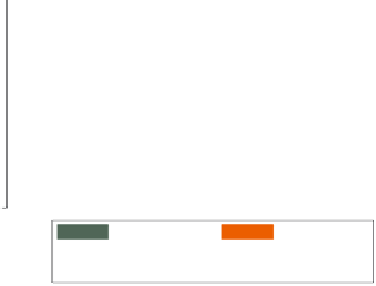
colors, and a legend is used to identify
the
-variables.
Uses nlsw.dta & scheme vg s1c
y
mean of wage
mean of hours
mean of tenure
mean of ttl_exp
mean of age
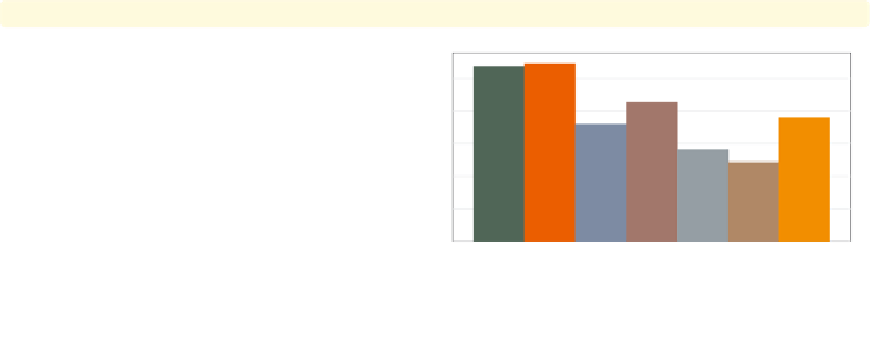
graph bar wage, over(occ7) asyvars
This is another example of where a
legend can arise in a Stata bar graph by
specifying the
asyvars
option, which
treats an
over()
variable as though the
levels were different
-variables.
Uses nlsw.dta & scheme vg s1c
y
Prof
Mgmt
Sales
Cler.
Operat.
Labor
Other
Unless otherwise mentioned, the legend options described below work the same regard-
less of whether the legend was derived from multiple
-variables or from an
over()
variable
that was combined with the
asyvars
option. These next examples use the
vg s2m
scheme.
y
The electronic form of this topic is solely for direct use at UCLA and only by faculty, students, and staff of UCLA.