Graphics Reference
In-Depth Information
graph hbar wage hours tenure ttl exp age,
nolabel
The
nolabel
option only works when
you have multiple
y
-variables. When it
is used, the variable names (not the
variable labels) are used in the legend.
For example, instead of showing the
variable label
hourly wage
,itshows
the variable name
wage
.
Uses nlsw.dta & scheme vg s2m
0
10
20
30
40
wage
hours
tenure
ttl_exp
age
graph hbar wage hours tenure ttl exp age,
showyvars
The
showyvars
option puts the labels
on the axis, beside or “under” the bars.
Uses nlsw.dta & scheme vg s2m
mean of wage
mean of hours
mean of tenure
mean of ttl_exp
mean of age
0
10
20
30
40
mean of wage
mean of hours
mean of tenure
mean of ttl_exp
mean of age
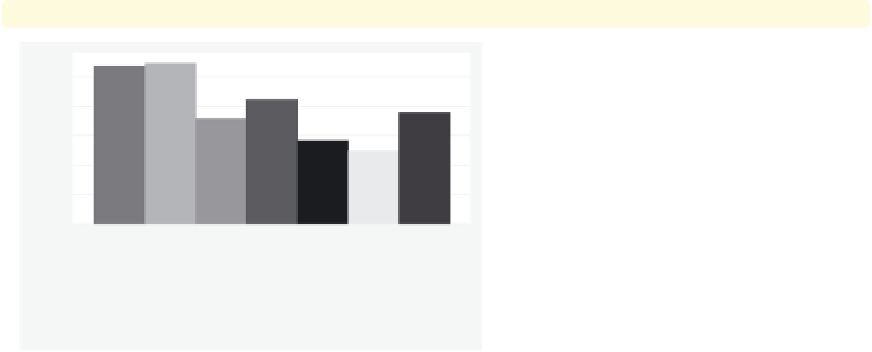
graph bar wage, over(occ7) asyvars
showyvars
Even though the
showyvars
option
sounds like it would work only with
multiple
-variables, it also works when
you combine the
over()
and
asyvars
options. As you can see, the legend is
now redundant and could be
suppressed.
Uses nlsw.dta & scheme vg s2m
y
Prof
Mgmt
Sales
Cler.
Operat.
Labor
Other
Prof
Mgmt
Sales
Cler.
Operat.
Labor
Other
The electronic form of this topic is solely for direct use at UCLA and only by faculty, students, and staff of UCLA.