Graphics Reference
In-Depth Information
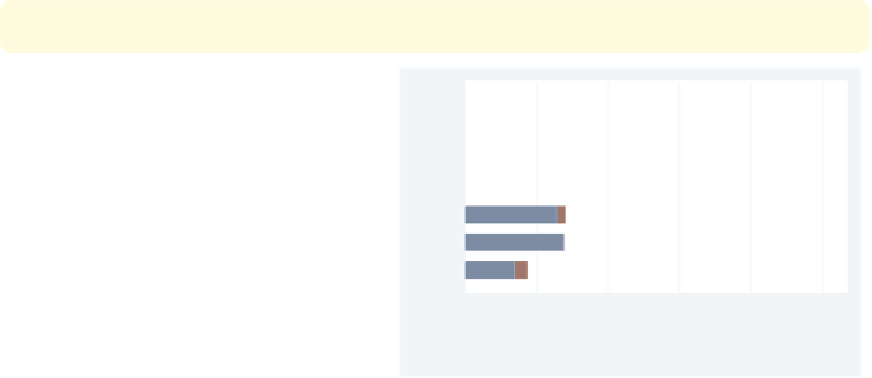
graph hbar (sum) wage,
over(collgrad) over(occ7, sort((sum) wage)
descending
) asyvars stack
Here, we add the
descending
option to
change the sort order from highest to
lowest. Note the placement of the
descending
option outside of the
sort()
option.
Uses nlsw.dta & scheme vg s2c
Sales
Prof
Mgmt
Other
Labor
Operat.
Cler.
0
1,000
2,000
3,000
4,000
5,000
sum of wage
not college grad
college grad
4.4
Controlling the categorical axis
This section describes ways that you can label categorical axes. Bar charts are special
since their
x
-axis is formed by categorical variables. This section describes options you can
use to customize these categorical axes. For more details, see [
G
]
cat axis label options
and [
G
]
cat axis line options
.
We will start by exploring how you can change the labels for the bars on the
x
-axis.
graph bar wage, over(grade6) over(south)
asyvars
This bar chart breaks wages down by
education level and whether one lives in
the South. Adding the
asyvars
option
graphs the levels of education level as
differently colored bars, as though they
were different
-variables. More
importantly, note that the variable
south
is coded 0/1 and has no labels,
leaving the
y
x
-axis poorly labeled.
Uses nlsw.dta & scheme vg s2c
0
1
No HS
Some HS
HS Grad
Some Coll
Coll Grad
Post Grad
The electronic form of this topic is solely for direct use at UCLA and only by faculty, students, and staff of UCLA.