Graphics Reference
In-Depth Information
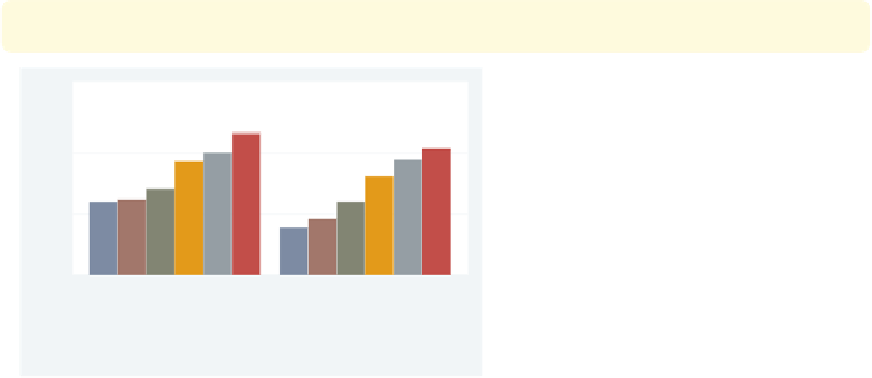
graph bar wage, over(grade6) over(south,
relabel(1 "N & W" 2 "South")
)
asyvars
The
relabel()
option is used to
change the labels displayed for the
levels of
south
, giving the
-axis more
meaningful labels. Note that we wrote
relabel(1 "N & W")
and not
relabel(0 "N & W")
since these
numbers do not represent the actual
levels of
south
but the ordinal position
of the levels, i.e., first and second.
Uses nlsw.dta & scheme vg s2c
x
N & W
South
No HS
Some HS
HS Grad
Some Coll
Coll Grad
Post Grad
graph bar wage, over(grade6) over(union,
relabel(3 "missing")
)
missing
asyvars
Consider this example, where we show
wages broken down by education and
union membership with the
missing
option to show a separate category for
missing values. Normally, the bar for
the missing category would be labeled
with a dot, but here we add the
relabel()
option to label that
category with the word “missing”.
Uses nlsw.dta & scheme vg s2c
nonunion
union
missing
No HS
Some HS
HS Grad
Some Coll
Coll Grad
Post Grad
.
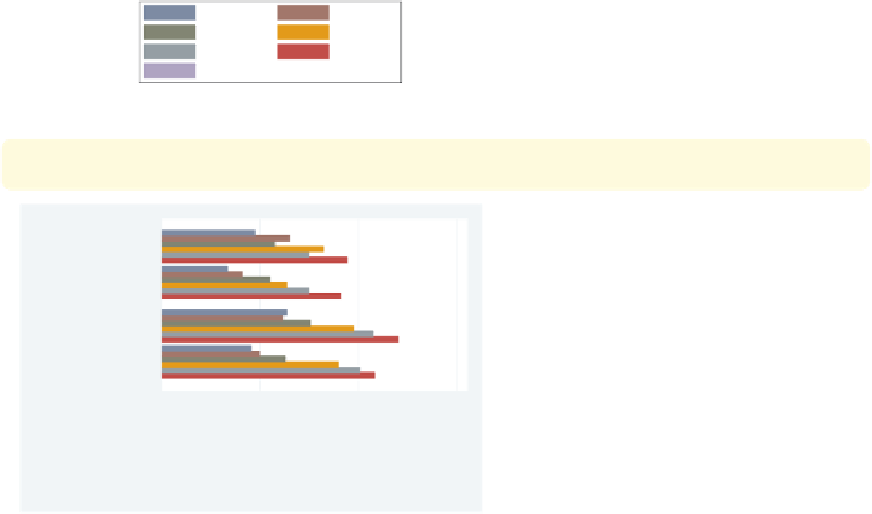
graph hbar wage, over(grade6) over(south,
relabel(1 "N & W" 2 "South")
)
over(smsa,
relabel(1 "Non Metro" 2 "Metro")
)
This is an example of a bar chart with
three
over()
variables, two of which we
relabel. The
relabel()
option is used
to change the labels for the levels of
south
and
smsa
. Note each
over()
option can have its own
relabel()
option.
Uses nlsw.dta & scheme vg s2c
N & W
Non Metro
South
N & W
Metro
South
0
5
10
15
mean of wage
No HS
Some HS
HS Grad
Some Coll
Coll Grad
Post Grad
The electronic form of this topic is solely for direct use at UCLA and only by faculty, students, and staff of UCLA.