Graphics Reference
In-Depth Information
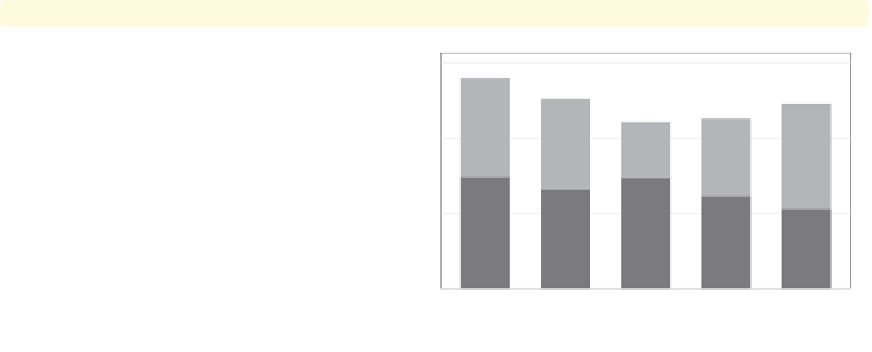
graph bar prev exp tenure, over(occ5)
stack
The
stack
option shows the
-variables
as a stacked bar chart. This allows you
to see the mean of each
y
-variable, as
well as the mean of the total
y
y
-variables.
Uses nlsw.dta & scheme vg s1m
Prof/Mgmt
Sales
Clerical
Labor/Ops
Other
mean of prev_exp
mean of tenure
graph bar prev exp tenure, over(occ5)
percentages stack
We can also combine the
stack
and
percentages
options to create a
stacked bar chart in terms of
percentages.
Uses nlsw.dta & scheme vg s1m
Prof/Mgmt
Sales
Clerical
Labor/Ops
Other
mean of prev_exp
mean of tenure
4.2
Graphing bars over groups
This section focuses on the use of the
over()
option for showing bar charts by one
or more categorical variables.
It illustrates the use of the
over()
option with a single
y
-variables. We also look at some basic options, including
options for displaying the
over()
variable as though its levels were multiple
-variable and with multiple
y
y
-variables,
including missing values on the
over()
variable, and suppressing empty combinations of
multiple
over()
variables. See the
group options
and
over subopts
tables of [
G
]
graph bar
for more details.
The electronic form of this topic is solely for direct use at UCLA and only by faculty, students, and staff of UCLA.