Graphics Reference
In-Depth Information
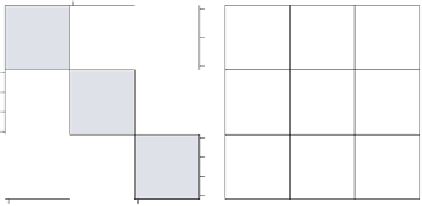
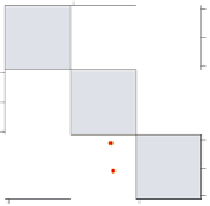
graph matrix propval100 ownhome borninstate, by(north, compact
scale(*1.3)
)
maxes(ylabel(, nolabels))
We can use the
scale()
option to
increase the size of the markers, labels,
and text to make them more readable.
This is especially useful when graphs
get small.
Uses allstates.dta & scheme vg brite
S & W
North
50
60
70
80
60
70
80
% homes
cost
$100K+
% homes
cost
$100K+
% who
own
home
% who
own
home
% born in
state of
residence
% born in
state of
residence
0
50
100
20
40
60
80
0
50
100
40
60
80
Graphs by Region North or Not
The electronic form of this topic is solely for direct use at UCLA and only by faculty, students, and staff of UCLA.