Graphics Reference
In-Depth Information
graph matrix propval100 ownhome borninstate, by(north,
compact
)
To display the graphs closer together,
you can use the
compact
option.
Uses allstates.dta & scheme vg brite
S & W
North
50
60
70
80
60
70
80
100
100
% homes
cost
$100K+
% homes
cost
$100K+
50
50
0
0
80
80
70
% who
own
home
% who
own
home
70
60
50
60
80
80
% born in
state of
residence
% born in
state of
residence
60
60
40
20
40
0
50
100
20
40
60
80
0
50
100
40
60
80
Graphs by Region North or Not
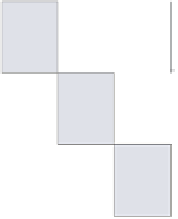
twoway
scatter
propval100 ownhome, by(north,
compact
)
If we compare the previous scatterplot
matrix to this twoway scatterplot, we
see that the
compact
option does not
make the scatterplot matrix as compact
as it does with a regular
twoway
scatter
command, which joins the two
graphs on their edges by omitting the
y
S & W
North
-labels between the two graphs.
Uses allstates.dta & scheme vg brite
50
60
70
8050
60
70
80
% who own home
Graphs by Region North or Not
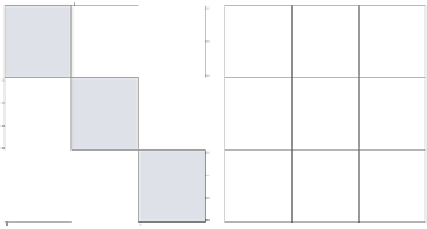
graph matrix propval100 ownhome borninstate, by(north, compact)
maxes(ylabel(, nolabels))
We can make the
graph matrix
display
more compactly with the
by()
option
by using the
maxes(ylabel(,
nolabels))
option to suppress the
labels on all of the
S & W
North
50
60
70
80
60
70
80
% homes
cost
$100K+
% homes
cost
$100K+
-axes. Then, when
we use the
compact
option, the edges of
the plots are pushed closer together.
Uses allstates.dta & scheme vg brite
y
% who
own
home
% who
own
home
% born in
state of
residence
% born in
state of
residence
0
50
100
20
40
60
80
0
50
100
40
60
80
Graphs by Region North or Not
The electronic form of this topic is solely for direct use at UCLA and only by faculty, students, and staff of UCLA.