Graphics Reference
In-Depth Information
3.3
Matrix options
This section shows options that you can use to control the look of the scatterplot matrix,
including showing just the lower half of the matrix, jittering markers, and scaling the size
of marker text. For more details, see [
G
]
graph matrix
. These graphs use the
vg s2m
scheme.
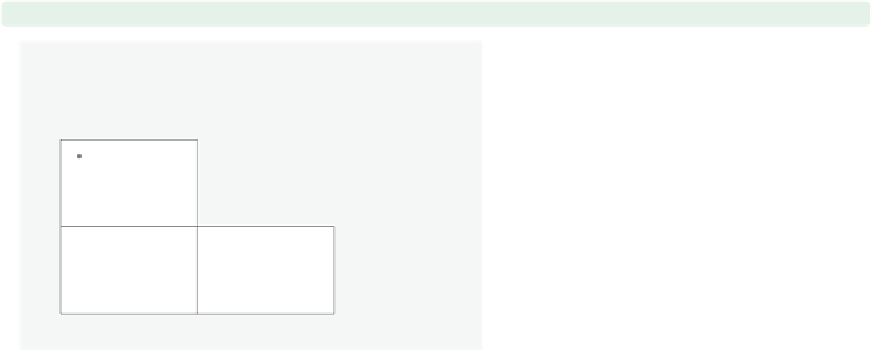
graph matrix propval100 ownhome region,
half
You can use the
half
option to display
just the lower diagonal of the
scatterplot matrix.
Uses allstates.dta & scheme vg s2m
% homes
cost
$100K+
80
% wh
o
own
home
60
40
4
3
Census
region
2
1
0
50
100
40
60
80
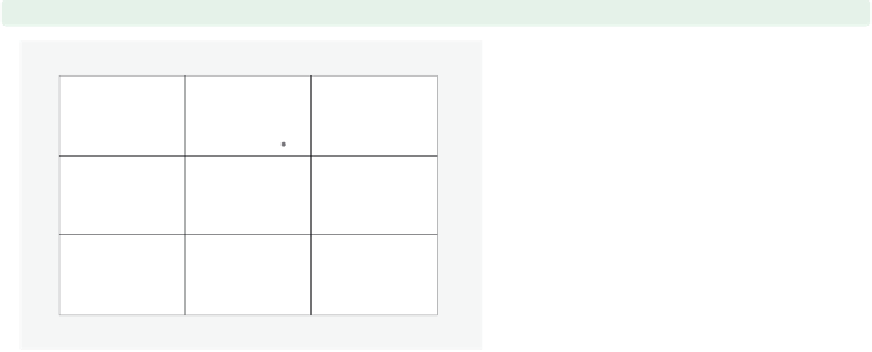
graph matrix propval100 ownhome region,
jitter(3)
You can use the
jitter()
option to
add random noise to the points; the
higher the value given, the more
random noise is added. This is
especially useful when numerous
observations have the same (
40
60
80
100
% homes
cost
$100K+
50
0
80
)
values, so a number of observations can
appear as a single point.
Uses allstates.dta & scheme vg s2m
x
,
y
% who
own
home
60
40
4
3
Census
region
2
1
0
50
100
1
2
3
4
The electronic form of this topic is solely for direct use at UCLA and only by faculty, students, and staff of UCLA.