Graphics Reference
In-Depth Information
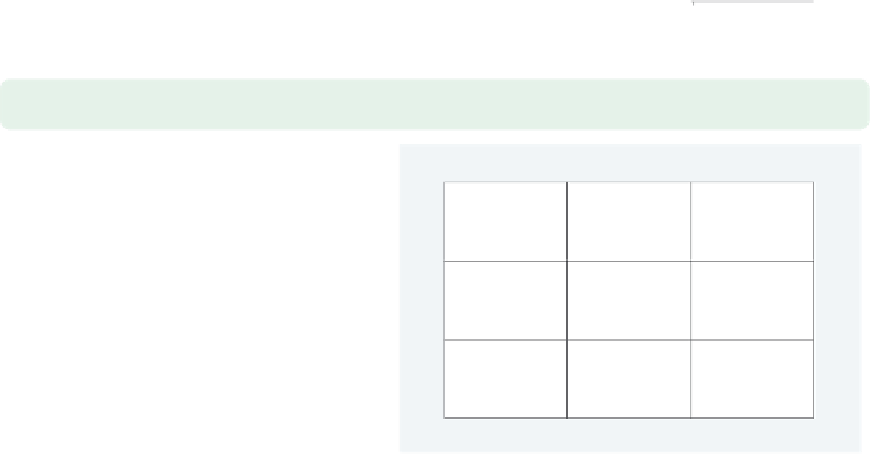
graph matrix urban propval100 borninstate,
diagonal("% Urban" "% Homes Over $100K" "% Born in State")
When you use
twoway scatter
,you
can use
xtitle()
and
ytitle()
to
control the titles for the axes. By
contrast, when using
graph matrix
,
you can control the titles that are
displayed along the diagonal with the
diagonal()
option. We use the
diagonal()
option to change the titles
for all variables.
Uses allstates.dta & scheme vg s2c
0
50
100
100
80
%
Urban
60
40
100
% Homes
Over
$100K
50
0
80
% Born
in
State
60
40
20
40
60
80
100
20
40
60
80
graph matrix urban propval100 borninstate,
diagonal("% Urban"
.
"% Born in State")
We do not have to change all the titles.
If we want to change just some of the
titles, we can place a period (
.
) for the
labels where we want the label to stay
the same. In this example, we change
the titles for the first and third
variables but leave the second as is.
Uses allstates.dta & scheme vg s2c
0
50
100
100
80
%
Urban
60
40
100
% homes
cost
$100K+
50
0
80
% Born
in
State
60
40
20
40
60
80
100
20
40
60
80
graph matrix urban propval100 borninstate,
diagonal("% Urban" . "% Born in State",
bfcolor(eggshell)
)
We can control the display of the text
on the diagonal using textbox options.
For example, we make the background
color of the text area eggshell using the
bfcolor(eggshell)
option. See
Options : Textboxes
(303) for more
examples of textbox options.
Uses allstates.dta & scheme vg s2c
0
50
100
100
80
%
Urban
60
40
100
% homes
cost
$100K+
50
0
80
% Born
in
State
60
40
20
40
60
80
100
20
40
60
80
The electronic form of this topic is solely for direct use at UCLA and only by faculty, students, and staff of UCLA.