Graphics Reference
In-Depth Information
NOTE
Gamma experts, please take this as your personal invitation not to write letters about how this
bit is a complete travesty of the importance and complexity of Gamma in the world of imaging.
If the story's good, people will never notice that the Gamma's a little off. If the story is awful, the
world's greatest Gamma technician will never save it.
In lieu of the reams of technical explanations, mathematics, and general silliness that it would take to make
you an expert in Gamma correction, I will suggest a method that I call “The Optometrist.” If you've ever
been to the eye doctor and had to get corrective lenses, you will be familiar with the optometrist's tech-
nique of fi nding the exact lenses that you will need.
They put one lens in front of your eye, then a dif-
ferent one. They switch back and forth a few times
and ask, “One? Or two?” You tell them which looks
better. In this way, they go through a number of dif-
ferent corrections until they narrow it down to the
best one for you.
The same technique can be applied to making
midtone adjustments to your images. In an RGB
Curves node, grab the midpoint and pull it around.
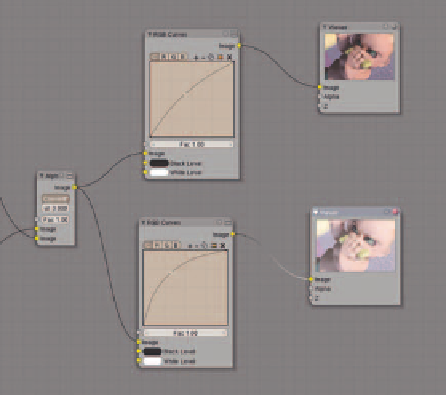
Figure 15.48 shows a node tree for performing an
“Optometrist” on your image. The
Background
button is enabled so that the active
Viewer
node is
displayed there. In this way, you can set two differ-
ent Gamma curves, one in each RGB Curve node,
then switch between the two by clicking on the two
viewer nodes. Better? Worse? One, or two? Most
likely, you will end up applying a similar adjustment
to all of your images, but some experimentation will
be benefi cial.
Figure 15.48
The Optometrist node tree (background is not
enabled here for illustrative clarity)
Combining the Techniques
Of course, midtone adjustment can be combined
with the contrast curve from the previous section
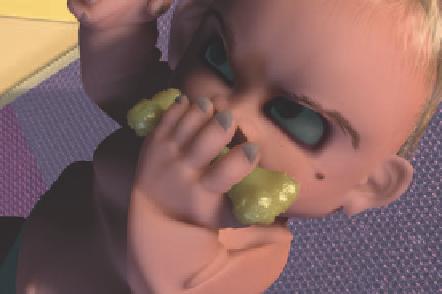
into a single correction curve. Figs. 15.49 and 15.50
show the original image that has been used in these
sections and a fi nal brightness and contrast adjusted
image. The RGB transformation curve is shown in
Figure 15.51.
Figure 15.49
The original image

Search WWH ::

Custom Search