Agriculture Reference
In-Depth Information
20
186
15
109
176
95
5
2
1
9
13
0
92
79
11
12
3
51
57
118
119
128
43
47
127
0
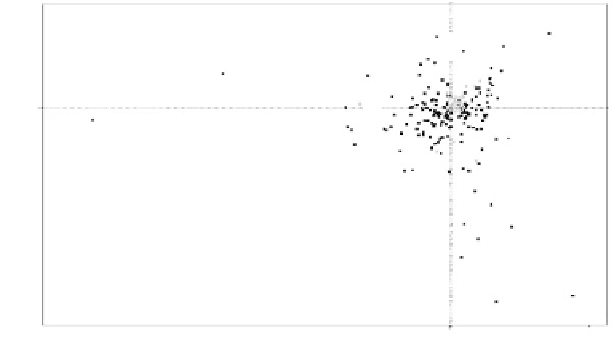
Dim 2
fIGuRe 7.2
Scatterplot of dimension 1 against dimension 2 in a simple correspondence
analysis of village against researcher-proposed land-use unit (LUU)-level indicators mea-
sured in January 2000. See CD for color image and key.
ing for 39.8% of the total inertia, changed only slightly, with the first dimension
relating strongly to production characteristics of the LUU and the second relating to
water availability and quality.
7.3.2 e
v A l u A t i of in
of f
t
e m p of r A l
t
r e n D s
i in
t h e
r
e s e A r C h e r
-p
r o p o s e D
i
n D i C A t of r s
The dimensions with the lowest correlation coefficients were 15 (
r
= 0.72), 19 (
r
= 0.74),
23 (
r
= 0.74), and 3 (
r
= 0.75). Figure 7.3 shows the change in inertia of categories along
dimension 15 between the January 1999 (DIM13R1) and the January 2000 (DIM13R2)
indicator measurements. Categories 39 (inputs/income for livestock = H [high]), 40
(inputs/income for livestock = L [low]), 58 (proportion traditional foods = H), 81
(hospitalizations = L), 83 (hospital visits = H), 101 (maize yield = H), 122 (per capita
income = E), 130 (potatoes yield = H), 170 (average wage = H), and 171 (wage = L)
showed the most change along this dimension.
Categories 16 (beans yield = H), 80 (hospitalizations = H), 84 (hospital visits =
L), 95 (kale yield = H), 122 (per capita income = E), 130 (potatoes yield = H), 133
(production score = H), and 136 (profitability = E) showed the most change in inertia
along dimension 19 (Figure 7.4). Among those that showed the most change along
dimension 23 were categories 16 (beans yield = H), 17 (beans yield = H), 81 (hos-
pitalizations = L), 96 (kale yield = L), 102 (maize yield = L), and 130 (potatoes
yield = H) (Figure 7.5). Along dimension 3, the most change in inertia was by catego-
ries 3 (available labor/acre = H), 35 (cost/inputs of food crops = E), 35 (cost/inputs
of food crops = L), 80 (hospitalizations = H), 89 (income/acre of food crops = E), 89
(income/acre of food crops = L), 96 (kale yield = L), 122 (per capita income = E), and
136 (profitability = E) (Figure 7.6).
Figure 7.7 shows the location of categories along dimensions 15 and 19 based
on an MCA of the 1999 measurements with the January 2000 measurements as

Search WWH ::

Custom Search