Biomedical Engineering Reference
In-Depth Information
0.9
0.9
0.85
0.85
0.8
0.8
0.75
0.75
0.7
0.7
0.65
0.9
1
1.1
1.2
1.3
1.4
1.5
1.3
1.4
1.5
1.6
1.7
1.8
G
D
f1
/
D
fd
H
D
f2
/
D
fd
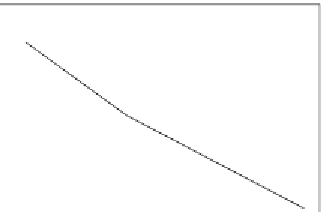
Figure 9.8—cont'd
(g) Decrease in the affinity, k
1
/k
d
with an increase in the fractal dimension ratio, D
f1
/D
fd.
(h) Increase in the affinity, k
2
/k
d
with an increase in the fractal dimension ratio, D
f2
/D
fd.
Figure 9.8a
and
Table 9.7
show the increase in the binding rate coefficient,
k
1
, with an
increase in the stimulation frequency in Hz for a dual-fractal analysis. For the data shown
in
Figure 9.8a
and in the 40-160 Hz range, the binding rate coefficient,
k
1
, is given by:
1
:
153
0
:
0771
k
1
¼ð
0
:
153
0
:
012
Þ½
Hz
ð
9
:
5a
Þ
The fit is very good. Only three data points are available. The availability of more data points
would lead to a more reliable fit. The binding rate coefficient,
k
1
exhibits slightly higher than first
(equal to 1.157) order of dependence on the stimulation frequency in Hz in the 40-160 Hz range.
Figure 9.8b
and
Table 9.7
show for a dual-fractal analysis the increase in the binding rate
coefficient,
k
1
with an increase in the stimulation frequency in Hz. For the data shown in
Figure 9.8b
and in the 40-160 Hz range, the binding rate coefficient,
k
2
is given by:
1
:
319
0
:
365
k
2
¼ð
0
:
0695
0
:
0298
Þ½
Hz
ð
9
:
5b
Þ
The fit is very good. Only three data points are available. The availability of more data points
would lead to a more reliable fit. The binding rate coefficient,
k
2
, exhibits slightly higher than
first (equal to 1.153) order of dependence on the stimulation frequency in Hz in the 40-160 Hz
range. It is of interest to note that the binding rate coefficient,
k
2
, exhibits a slightly higher
order of dependence (equal to 1.319) than the binding rate coefficient,
k
1
, on the stimulation
frequency in Hz in the 40-160 Hz range.
Figure 9.8c
and
Table 9.7
show the increase in the fractal dimension,
D
f1
, with an increase in
the stimulation frequency in Hz for a dual-fractal analysis. For the data shown in
Figure 9.8c
and in the 40-160 Hz range, the fractal dimension,
D
f1
, is given by:
0
:
2405
0
:
02329
D
f1
¼ð
0
:
6709
0
:
0155
Þ½
Hz
ð
9
:
5c
Þ