Biomedical Engineering Reference
In-Depth Information
dissociation kinetics. The values of (a) the binding rate coefficient,
k
, and the fractal dimen-
sion,
D
f
, for a single-fractal analysis, and (b) the dissociation rate coefficient,
k
d
, and the frac-
tal dimension for the dissociation phase,
D
fd
, for a single-fractal analysis are given in
Tables 8.4
and
8.5
. In this case, the affinity,
K
(
¼
k
/
k
d
), value is 12.96.
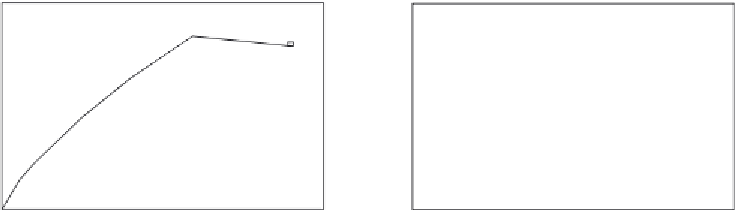
Figure 8.12a
shows the binding and dissociation of 60 mM oxazaborolidine derivative,
BNO4
2 mM sucrose in solution to FTF immobilized on a SPR sensor chip surface
(
Jabbour et al., 2007
). A single-fractal analysis is adequate to describe the binding and the
dissociation kinetics. The values of (a) the binding rate coefficient,
k
, and the fractal dimen-
sion,
D
f
, for a single-fractal analysis, and (b) the dissociation rate coefficient,
k
d
, and the frac-
tal dimension for the dissociation phase,
D
fd
, for a single-fractal analysis are given in
Tables 8.4
and
8.5
. In this case, the affinity,
K
(
þ
¼
k
/
k
d
), value is 5.23.
Figure 8.12b
shows the binding and dissociation of 150
m
M oxazaborolidine derivative,
BNO3
2 mM sucrose in solution to FTF immobilized on a SPR sensor chip surface
(
Jabbour et al., 2007
). A dual-fractal analysis is required to describe the binding kinetics.
A single-fractal analysis is adequate to describe the dissociation kinetics. The values of (a)
the binding rate coefficient,
k
, and the fractal dimension,
D
f
, for a single-fractal analysis,
(b) the binding rate coefficients,
k
1
and
k
2
, and the fractal dimensions,
D
f1
and
D
f2
, for a
dual-fractal analysis, and (c) the dissociation rate coefficient,
k
d
, and the fractal dimension,
D
fd
, for a single-fractal analysis are given in
Tables 8.4
and
8.5
. It is seen that a decrease
in the fractal dimension by a 51.5% from a value of
D
f1
equal to 2.3816 to
D
f2
equal to
1.1550 leads to a decrease in the binding rate coefficient by a factor of 20.08 from a value
of
k
1
equal to 16.640 to
k
2
equal to 0.8287. It is seen that a decrease in the fractal dimension
þ
500
160
140
400
120
100
300
80
200
60
40
100
20
0
0
100
200
300
400
500
0
100
200
300
400
500
0
B
A
Time (s)
Time (s)
Figure 8.12
Binding and dissociation of different concentrations (in
þ
2 mM sucrose in solution to fructosyltransferase (FTF) immobilized on a SPR sensor chip surface
(
Jabbour et al., 2007
): (a) 60 (b) 150. When only a solid line (—) is used then a single-fractal
analysis applies. When both a dashed (- - -) and a solid (—) line are used then the dashed line
represents a single-fractal analysis and the solid line represents a dual-fractal analysis.
M) oxazaborolidine derivative (BNO4)
m