Biomedical Engineering Reference
In-Depth Information
It is seen that, as expected, the order of dependence exhibited in
Equation (8.5)
above (equal
to 6.386) is in between that exhibited in
Equation (8.3a)
(for BNO1) equal to 4.996 and
Equa-
tion (8.4a)
(for BNO2) equal to 7.01. It would be of interest to plot how the binding rate co-
efficient,
k
, changes with the fractal dimension,
D
f
, separately and together for the other
oxazaborolidine derivatives. If all or most of the data points fit nicely together on a single
plot, then this indicates that the surface of the SPR biosensor chip is one of the major deter-
mining factors in influencing the quantitative value of the binding rate coefficient,
k
.
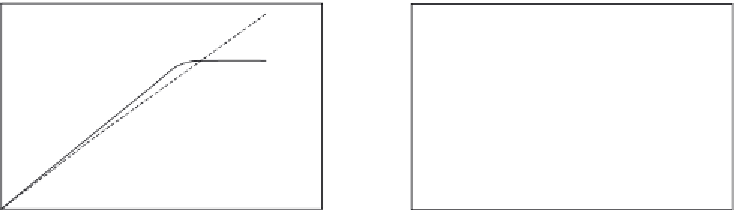
Figure 8.11a
shows the binding and dissociation of 30 nM oxazaborolidine derivative,
BNO3
2 mM sucrose in solution to FTF immobilized on a SPR sensor chip surface
(
Jabbour et al., 2007
). A dual-fractal analysis is required to describe the binding kinetics.
A single-fractal analysis is adequate to describe the dissociation kinetics. The values of
(a) the binding rate coefficient,
k
, and the fractal dimension,
D
f
, for a single-fractal analysis,
and (b) the binding rate coefficients,
k
1
and
k
2
, and the fractal dimensions,
D
f1
and
D
f2
,
for a dual-fractal analysis, and (c) the dissociation rate coefficient,
k
d
, and the fractal dimen-
sion,
D
fd
, for a single-fractal analysis are given in
Tables 8.4
and
8.5
. Note that an increase
in the fractal dimension by a factor of 3.08 from a value of
D
f1
equal to 0.9748 to
D
f2
equal to 3.0 (the maximum value) leads to an increase in the binding rate coefficient by a
factor of 118.81 from a value of
k
1
equal to 1.515 to
k
2
equal to 180.0. It is seen that an
increase in the fractal dimension or the degree of heterogeneity on the SPR biosensor chip
surface leads to an increase in the binding rate coefficient in the same direction.
þ
Figure 8.11b
shows the binding and dissociation of 0.006 nM oxazaborolidine derivative,
BNO3
2 mM sucrose in solution to FTF immobilized on a SPR sensor chip surface
(
Jabbour et al., 2007
). A single-fractal analysis is adequate to describe the binding and the
þ
250
700
600
500
400
300
200
100
200
150
100
50
0
0
0
50
100
150
200
0
50
100
150
200
A
B
Time (s)
Time (s)
Figure 8.11
Binding and dissociation of different concentrations (in nM) oxazaborolidine derivative (BNO3)
þ
2 mM sucrose in solution to fructosyltransferase (FTF) immobilized on a SPR sensor chip surface
(
Jabbour et al., 2007
): (a) 30 (b) 0.006. When only a solid line (—) is used then a single-fractal
analysis applies. When both a dashed (- - -) and a solid (—) line are used then the dashed line
represents a single-fractal analysis and the solid line represents a dual-fractal analysis.