Biomedical Engineering Reference
In-Depth Information
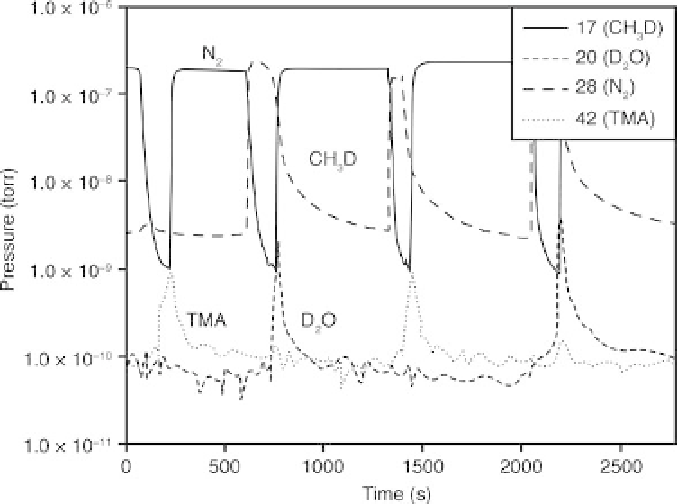
8.3 In situ mass spectrometry results of Al
2
O
3
ALD using TMA and D
2
O
(King et al., 2009). Reproduced by permission of the Electrochemical
Society.
instances greater than 98%) have been observed at the point of break-
through (King et al., 2007). It is clear that all TMA entering the reactor was
completely utilized until the time at which the TMA signal increased, which
is called the 'breakthrough' time. Just after the TMA breakthrough time, the
TMA dose was stopped, and N
2
was fed into the reactor to purge any
residual reaction product or unused TMA from the system. After the N
2
purge, D
2
O was dosed (half reaction B) and the CH
3
D signal increased
instantaneously. As the D
2
O dose proceeded, the reaction product began to
decrease, and the signal of D
2
O(m/z=20) appeared. At this point, the
surface reaction was nearly complete and N
2
was fed into the reactor to
purge any residual reaction product or unreacted D
2
O from the system.
After N
2
was purged from the system, the TMA was again dosed into the
reactor to begin another A half reaction, and there was an instantaneous
increase of the CH
3
D byproduct. This is reasonable since the particle
surfaces had been saturated with
OD groups. During both precursor
doses, it is apparent that the reactions were self-limiting and self-
terminating, because the reaction product increased and then decreased
while the reactants were still being dosed. If these reactions had not been
self-limiting, the product would continue to be generated as long as the
reactants were dosed. This real-time monitoring strategy allows for
optimizing the dose time of precursors to prevent process overruns and