Biomedical Engineering Reference
In-Depth Information
Glassy State
Glass
Glass
Transition
Glass Transition
ransition
Flow
years
months
days
hours
minutes
seconds
Stability Zone
C
Cr
itical Zone
Critical Zone
itical Zone
Mobility Zone
TEMPERATURE, WATER ACTIVITY OR WATER CONTENT
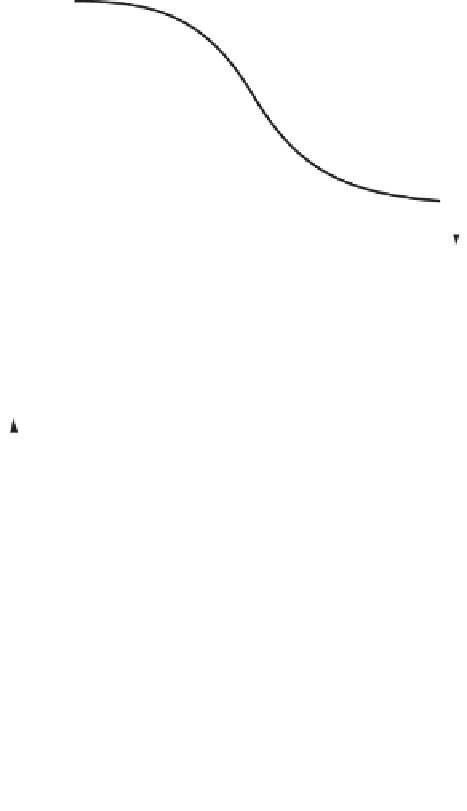
FIGURE 1.6
A schematic representation of relaxation times resulting in time-dependent
changes in mechanical properties and diffusion, described by the extent of change in property,
in amorphous food materials as a function of temperature, water activity, or water content.
T
g
of solids
Supersaturated
liquid state
T
m
Solution
T
m
Partial freeze-concentration
Maximum ice formation
T
g
Glass
Ice and glass
T
g
of water
Glass
C
g
WEIGHT FRACTION OF SOLIDS
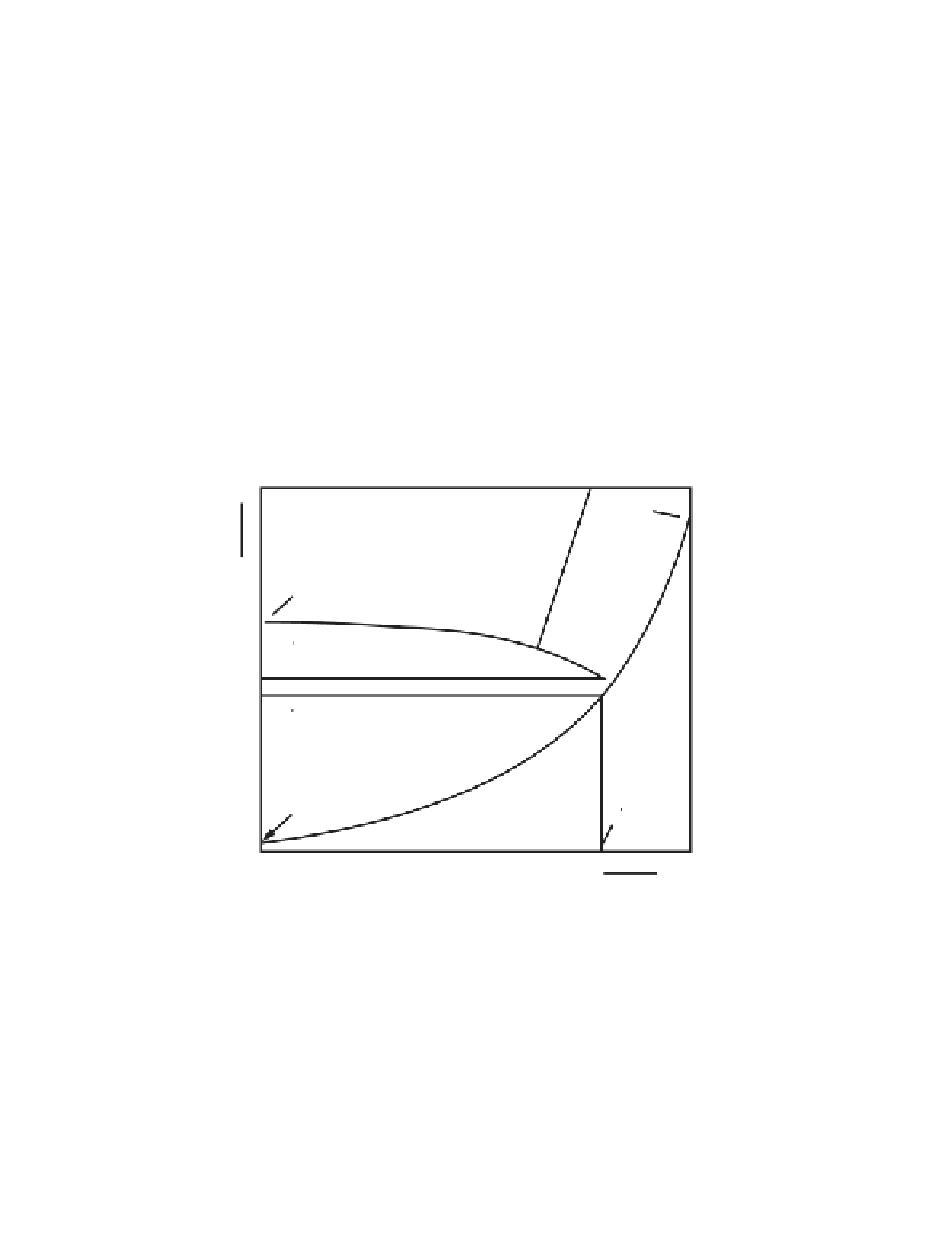
FIGURE 1.7
A typical state diagram of food materials showing the composition depen-
dence of the glass transition temperature, T
g
, equilibrium ice melting temperature, T
m
, the
effect of maximum freeze-concentration on the observed glass transition, T
′
g
, corresponding
solute concentration C
′
g
, and the onset of ice melting in the maximally freeze-concentrated
material, T
′
m
.
PHYSICAL STABILITY
R
ELAXATION
T
IMES AND
M
ECHANICAL
P
ROPERTIES
Mechanical properties of amorphous food materials are affected by glass transition
which may change textural characteristics. Rates of changes in mechanical properties
can be analyzed in terms of relaxation times. Williams et al.
58
reported that a single


Search WWH ::

Custom Search