Biomedical Engineering Reference
In-Depth Information
150
50
Glass Transition
Water Sor
ater Sor
ption
Water Sorption
Tg > 25˚C
Tg < 25˚C
100
40
50
30
0
20
-50
10
Stability Zone
C
Cr
itical aw
Critical a
w
Mobility Zone
-100
0
0
0.2
0.4
0.6
0.8
1.0
WATER ACTIVITY
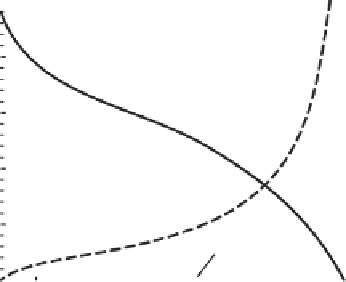
FIGURE 1.5
“Stability diagram” showing critical values for water content and water activ-
ity, a
w
, that depress the glass transition temperature, T
g
, to ambient temperature (25°C). The
data are those of a 20 DE (dextrose equivalent) maltodextrin.
32
at a constant temperature provides a simple method for prediction of storage relative
humidity (RH) effects on the T
g
. Such prediction is useful in the evaluation of
stability of various low- and intermediate-moisture foods, e.g., food powders, low-
moisture cereals, and snack foods, on the basis of the food material science concept.
Roos
32
used sorption models and the Gordon-Taylor equation for the description
of water plasticization. The models were fitted to experimental data and used to
show the T
g
and water sorption isotherm in a single plot. The information was used
to locate critical values for a
w
and water content, defined as those decreasing the T
g
defined parameter,
57
as it is dependent on the method of observation and its definition.
Therefore, it should be noticed that the stability and shelf life of food materials are
not governed by a single T
g
, a
w
, or water content value, but the rate of changes and
decrease in shelf life are likely to increase over a transition range as shown in
Figures 1.5
and
1.6
.
S
TATE
D
IAGRAMS
State diagrams are simplified phase diagrams that describe the concentration depen-
dence of the glass transition temperature of a food component or a food system.
6
State diagrams are effective tools in establishing relationships between the physical
state of food materials, temperature, and water content. State diagrams show the
glass transition temperature as a function of water content and the effect of ice
State diagrams may also show solubility as a function of temperature and information
on various changes that may occur due to the metastable state of amorphous food
solids, as they approach the equilibrium state. In food formulation and design, state
diagrams allow evaluation of the effects of food composition and water content on
the physical state and physicochemical properties during processing and storage.
53


Search WWH ::

Custom Search