Biomedical Engineering Reference
In-Depth Information
14
12
10
35
30
25
20
15
10
5
0
-30
16
14
12
10
8
8
6
6
4
4
30
20
20
2
20
2
10
10
10
0
0
0
0
0
-20
-20
-20
-10
-10
-10
-2
-10
-10
-10
0
0
0
10
10
-20
10
-20
20
-30
20
20
30
(a)
(b)
(c)
30
20
20
20
3.9%
10
10
26.8%
12.1%
10
7.4%
0
0
0
8.9%
-10
-10
-10
-20
1.6%
21.6%
29.7%
78.0%
-20
-20
-30
-20
-10
0
Horizontal Angle
10
20
-20
-10
0
Horizontal Angle
10
20
-30
-20
0
Horizontal Angle
-10
10
20
30
(d)
(e)
(f)
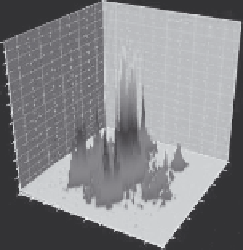
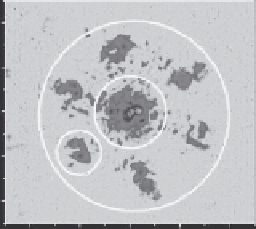
FIGURE 25.16
Images. showing. the. transmitted. power. in. the. diffraction. pattern. for. different. wavelengths. of. light:. (a,. d). blue,. 473. nm;. (b,. e). green,. 543. nm;. (c,. f). red,. 632. nm..
Comparing.the.transmission.ratios,.it.is.evident.that.there.is.enhanced.transmission.in.the.red.region,.with.approximately.78.%.transmitted.compared.to.21.%.for.
blue.laser.light.diffraction.patterns..Measurements.of.angular.separation.of.observed.diffracted.orders.for.each.laser.(e.g.,.14.1ð(ð0.5).for.the.irst.diffracted.orders.
using.472.nm).further.conirmed.that.the.2.μm.periodicity.was.the.source.of.the.observed.diffraction..(From.Lipson,.H.S.,.
Optical Transforms
,.Academic.Press,.New.
York,.1972.)