Biomedical Engineering Reference
In-Depth Information
(a)
(b)
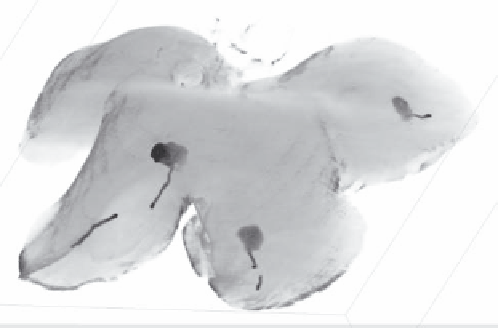
FIGURE 19.10
(a) CT reconstruction of the explanted liver. The saline sham was not visualized but contrast persisted in the treated areas with
each tract marked by a piece of pasta dipped in India ink. (b) A representative CT cross section and the corresponding section at gross pathology.
The attenuation due to contrast is not homogenous and is likely therefore unreliable for use as a real-time marker for an ablation.
All animals tolerated the injections well. Even four such
injections at the highest volume and the highest concentra-
tions produced no appreciable changes in the physiology.
Gross pathology of formalin-fixed specimens is shown in
Figure 19.12. Appearance of the tissue resembles charring
from hyperthermia in many cases, but based on the tempera-
tures seen, this was a possibility in only a rather small sub-
set of cases and would have only been likely right near the
center of an injection. These observations suggest that effects
other than temperature are also a factor in the outcomes. Peak
temperature observed at the highest concentration (15 M) was
105°C, and the maximum average peak temperature was 91°C.
The correlation between concentration and peak temperature
was apparent, as depicted in Figure 19.13.
Volume relationships, however, were not so simple and are still
not completely understood. This is illustrated in Figure 19.14.
The largest coagulum was not obtained using the most extreme
or energetic conditions (largest volume at highest concentra-
tion). At this stage, it is not clear whether this result is an artifact
or if it would prove a durable result. The nature of liver tissue is
such that it is rather porous, rich with vasculature, and very little
is yet known about the mechanism. Furthermore, there is likely
a maximum attainable volume from a point injection before
FIGURE 19.11
Histologic section of thermochemical ablation using
10 mol/L reagents. Coagulative necrosis is evident with ruptured cell
membranes, pale cytoplasm, shrunken and irregular nuclei, and hem-
orrhage (40X, H&E stain, bar equals 100 microns).
FIGURE 19.12
Typical formalin-fixed specimen following thermo-
chemical ablation, sectioned at 3 mm for volume and sphericity calcu-
lations. Simultaneous injection, 10 mol/L with 2cc each of acetic acid
and sodium hydroxide.